Reports
The Reports page provides a reporting capability that works across solutions and tenants. Using a powerful and fast backend database with report visualization capabilities, Reports enables customers to manage operations, analytics, and solution-specific needs all in one place.
The Fraud Transaction Monitoring Portal provides customers with out-of-the-box reporting for operations, analytics, and solutions that can be used by any customer and financial crime team.
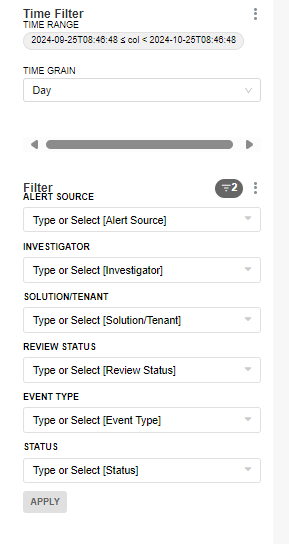
For each report, users will be able to apply further filters and adapt the data in charts through a range of UI-based tooling. Filters include time range, value, volume, tenant, status, rules, and model. These data manipulation tools can be applied through the filter section in the UI or by engaging with specific elements within the charts themselves.
Click Apply to save any changes to the filters.
For customers with multiple tenants, reports can be broken down per tenant or across multiple tenants depending on each user’s privileges. For example, a tenant level user will only have access to reports for their tenant while a landlord user will have greater access to data across tenants. This access is aligned with the permissions associated with each user role.
There are six reports that are available out-of-the-box.
|
Report |
Description |
|---|---|
|
Alerts Count and Value |
Provides an overview of the open and closed alerts in the date range selected. |
|
Alerts Generated |
Provides information about the total number of alerts generated in Fraud Transaction Monitoring Portal in a configurable time window. |
|
Alerts Closed |
Provides an overview of Closed alerts in the time range selected. |
|
Rules Summary |
Provides the number of rules triggered over time, grouped by rule. |
|
Model Summary |
Provides an overview of model performance across a specified time range. |
|
TP/FP Over Time |
Provides an overview of the analytics reports, showing values, volumes and rates through time, across all analytics measurements. |
All reports can be configured to suit your needs. If you need to revert back to the base report, contact Thredd.
Alerts Count and Value Report
The Alerts Count & Value report provides an overview of the open and closed alerts in the date range selected. This enables a manager or supervisor to quickly assess how many alerts have been generated, actioned, and what alerts still require review. The data available in this report can be narrowed down to the individual investigator level, which helps determine how the workload is spread. This report also enables an accurate count of the alerts generated and can show trends over time, allowing better projections in the future.
The Alerts Count and Value Report consists of multiple tabs that display a range of information on alerts.
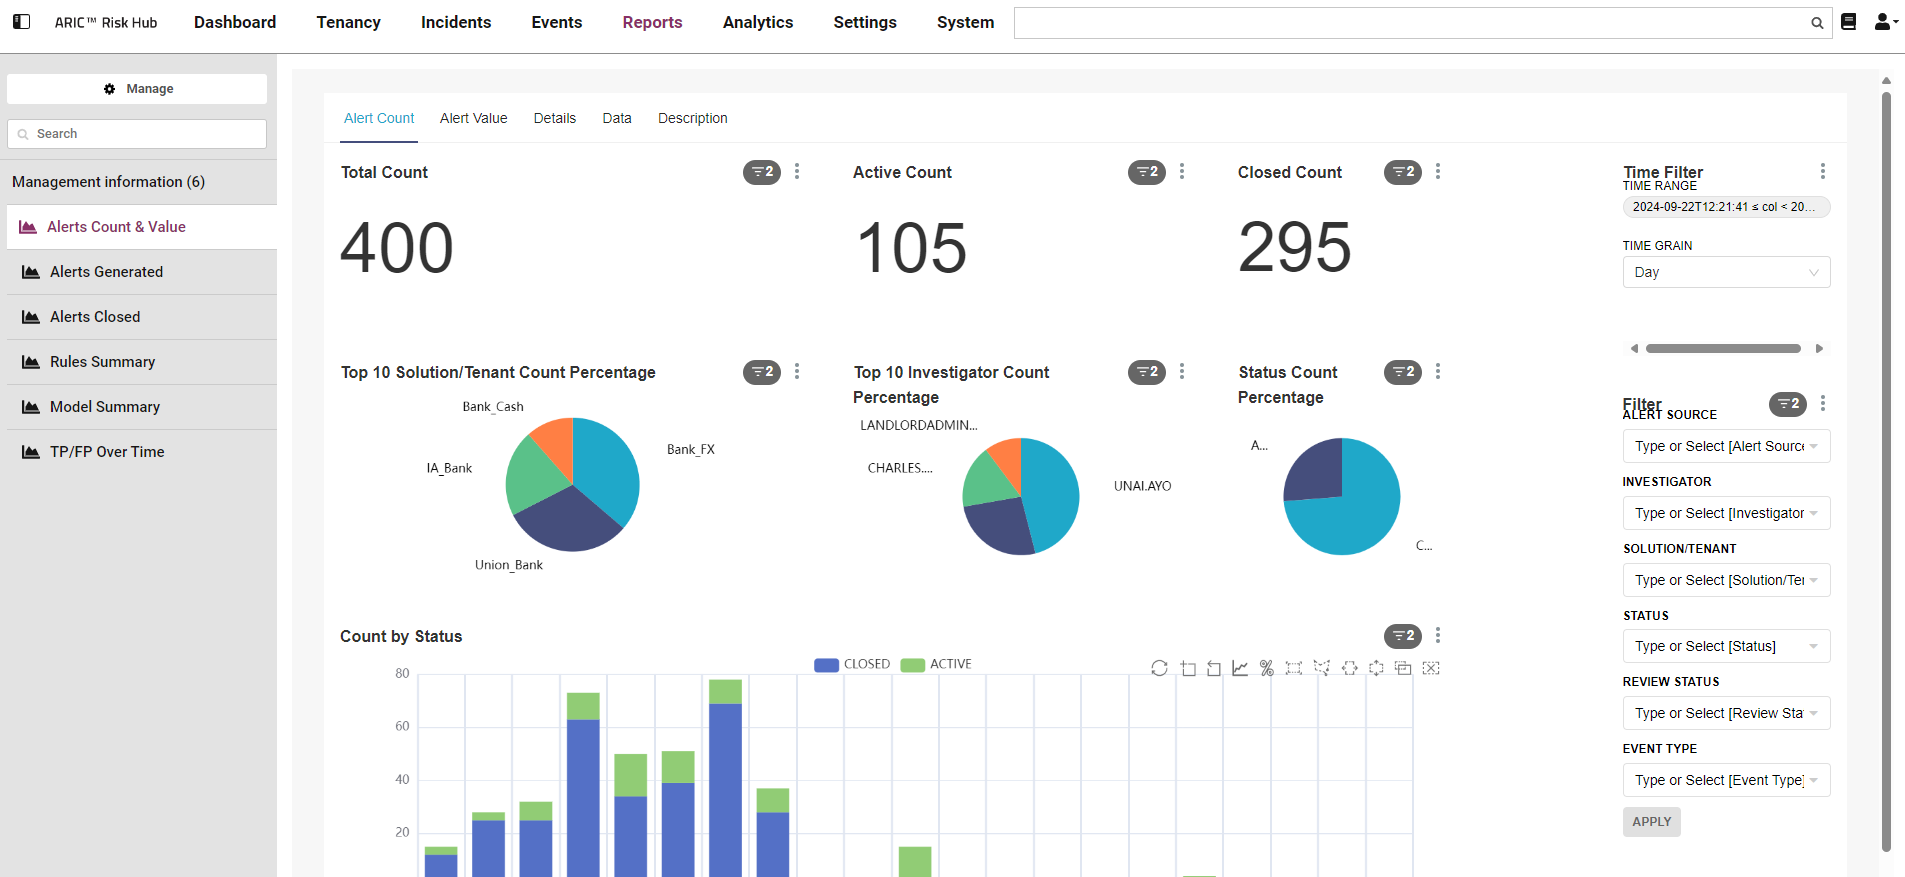
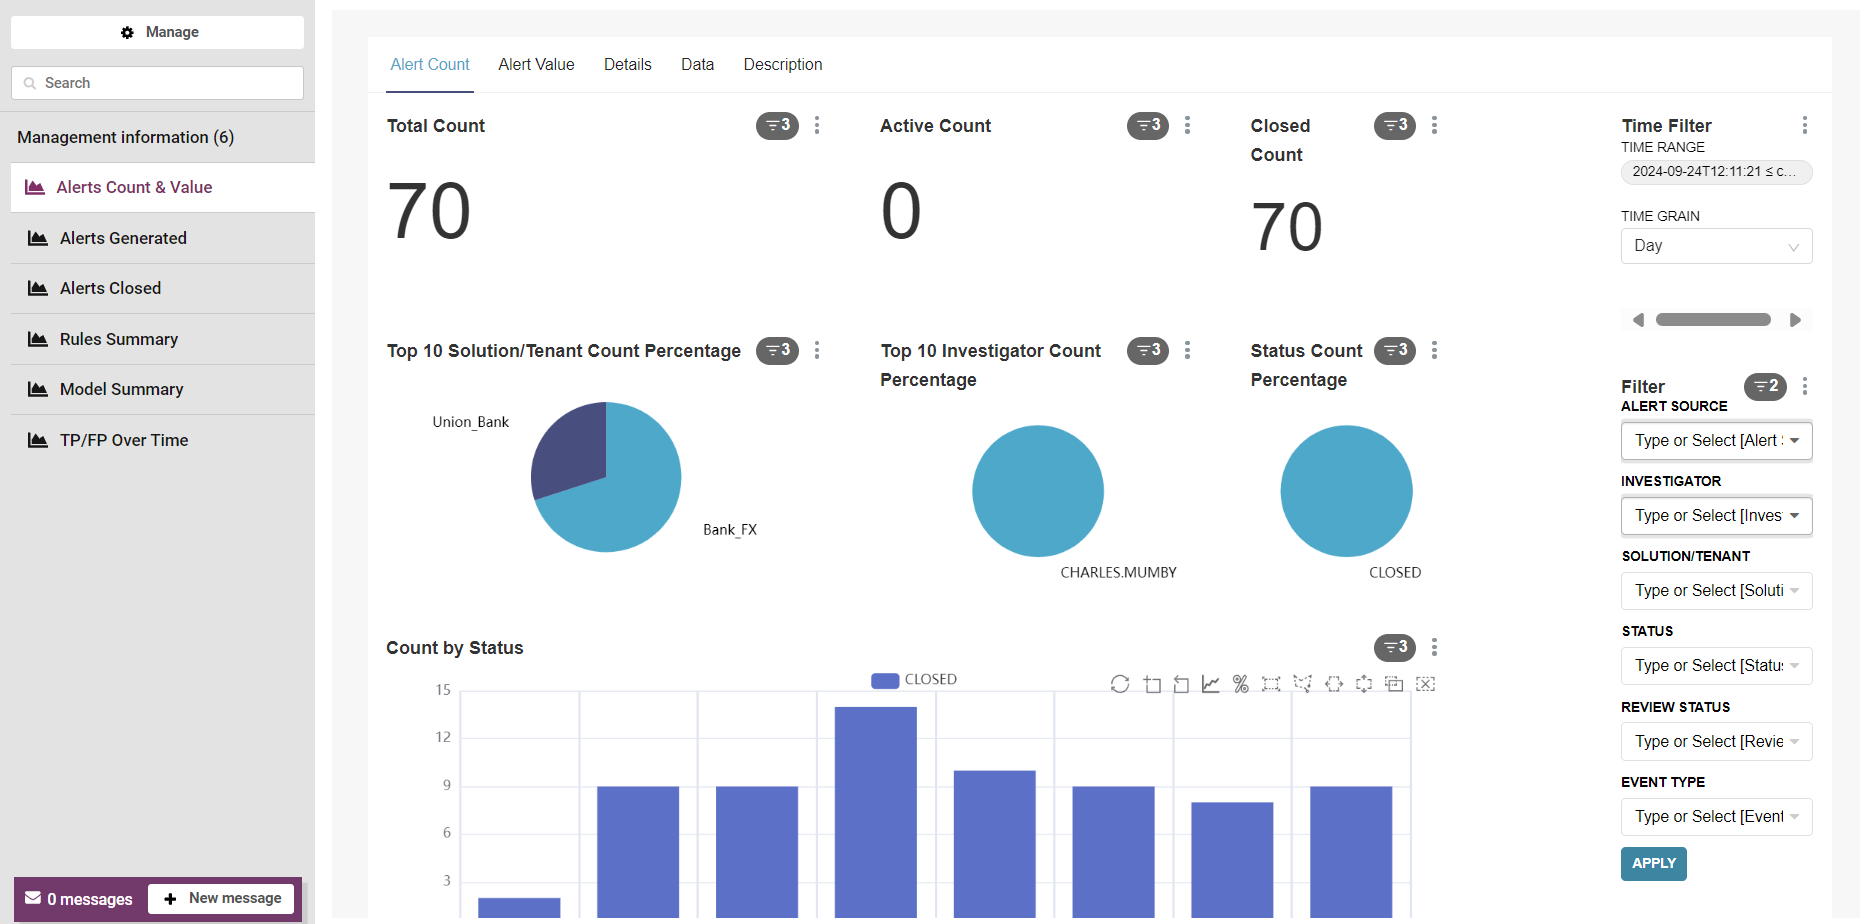
Alert Count Tab
The Alert Count tab displays reports for the amount of alerts in the date range selected. The following table describes each of the reports available.
|
Report |
Description |
|---|---|
|
Total Count |
Displays the total number of alerts generated by Fraud Transaction Monitoring Portal during the time interval defined in the filters, regardless of status and how they were generated. |
|
Active Count |
Displays the total number of active alerts generated by Fraud Transaction Monitoring Portal during the time interval defined in the filters. |
|
Closed Count |
Displays the number of closed alerts out of the alerts generated in a specific time range, regardless of when these alerts were closed. |
|
Top 10 Solution/Tenant Count Percentage |
Displays the top ten Solutions or Tenants contributing the largest percentages of total alerts. Hover over each slice to see the exact percentage the Tenant/Solution contributed. |
|
Top 10 Investigator Count Percentage |
Displays key investigators and their workloads, which can be used to ensure that team workloads are balanced. The Top 10 Investigator Count Percentage displays team members associated with the highest volume of closed alerts, including all closed alerts (unless changed in the filters.) |
|
Status Count Percentage |
Displays the percentage of alerts segmented by the values in the STATUS filter. For example, which alerts are ACTIVE or CLOSED in the time range specified in the filter. This helps to understand the ratio of alerts with different statuses in their Solutions. |
|
Count by Status |
Displays the volume of alerts that were active and the volume of alerts that were closed during the time interval defined in the filters. |
Alert Value Tab
The Alert value tab shows the same information as the Alert Count tab but for the financial value of the alerts.
The following table describes each of the reports available.
|
Report |
Description |
|---|---|
|
Total Value |
Displays the financial value associated with the total number of alerts generated by Fraud Transaction Monitoring Portal during the time interval defined in the filters, regardless of status and how they were generated. The currency used is defined in each tenant. |
|
Active Value |
Displays the total number of active alerts generated by Fraud Transaction Monitoring Portalduring the time interval defined in the filters, with details about the financial value associated with these alerts. |
|
Closed Value |
Displays the number of closed alerts out of the alerts generated in a specific time range, regardless of when these alerts were closed. The Closed Value report also provides details about the financial value associated with these alerts |
|
Top 10 Solution/Tenant Value Percentage |
Displays key investigators and their workloads to ensure that team workloads are balanced. The Top 10 Investigator Count Percentage shows team members associated with the highest financial value of closed alerts, including all closed alerts (unless changed in the filters.) |
|
Top 10 Investigator Value Percentage |
Displays which team members closed the highest financial value of alerts. This includes all alerts unless changed in the filters. This chart has details on the financial value associated with these alerts. |
|
Status Value Percentage |
Displays the percentage of alerts segmented by the values in the STATUS filter. For example, which alerts are ACTIVE or CLOSED in the time range specified in the filter. This helps you understand the ratio of alerts with different statuses in their Solutions. This chart has details on the financial value associated with these alerts. |
|
Value by Status |
Displays the financial value associated to the alerts that were active and the financial value associated to the alerts that were closed during the time interval defined in the filters. |
Details Tab
The Details tab provides a high-level breakdown of the data used to generate the visualizations displayed in the Alert Count and Alert Value tabs. The Details tab summarises the raw data into groups and provides the next level of data granularity.
Data Tab
The Data tab displays the raw data that is summarised in the Details tab and visualised in the Alert Count and Alert Values tabs.
Description Tab
Provides a high-level description of the charts and reports.
Alerts Generated Report
The Alerts Generated report provides information about the total number of alerts generated in Fraud Transaction Monitoring Portal in a configurable time window. Using this report, you can assess how many alerts have been created and alerts that are still active. These reports use the alert generated date to plot the data on a timeline. You can change the data displayed using the filters to focus on a specific period of time, such as daily, weekly, monthly or quarterly. These reports can also help you understand what type of alerts are most common and what is causing them.
The Alerts Generated Report consists multiple tabs that display a range of information on alerts.
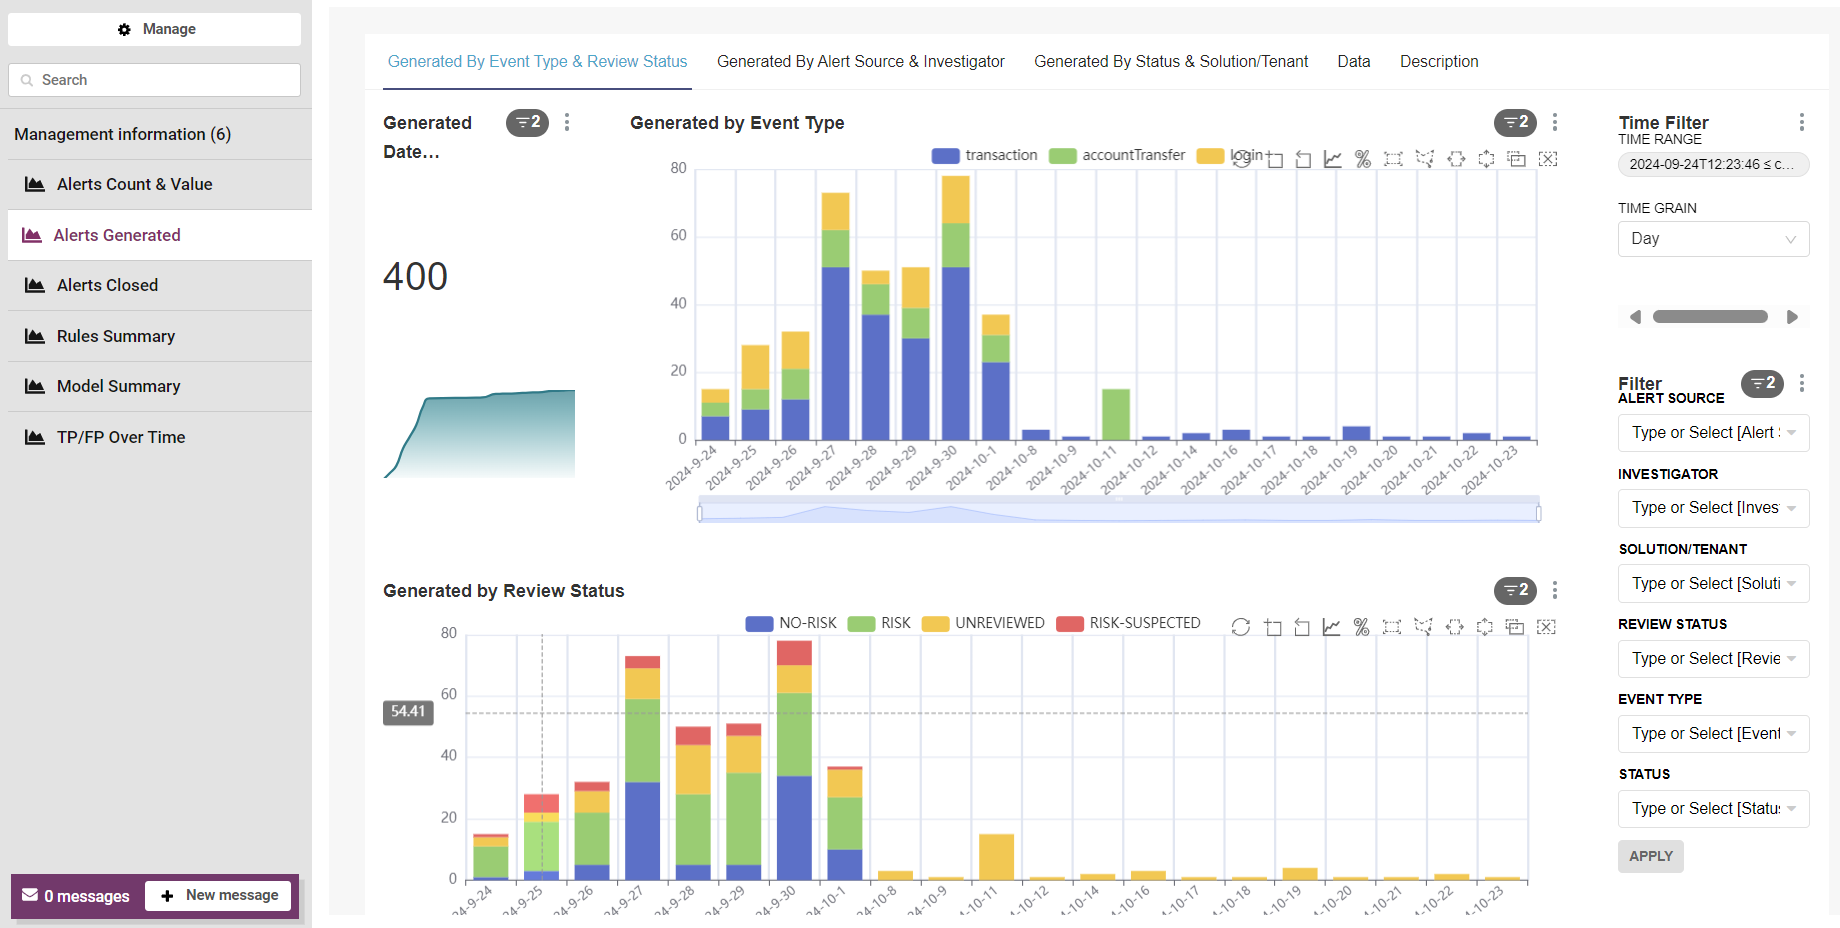
Generated By Event Type and Review Status Tab
The Generated By Event Type and Review Status Tab displays information on the total number of alerts generated, the types of event generated, and the review status of events generated.
The following table describes each of the reports available.
|
Report |
Description |
|---|---|
|
Generated Date Cumulative Count |
Displays the total number of alerts generated in Fraud Transaction Monitoring Portal and a graph with the cumulative count of alerts generated by Fraud Transaction Monitoring Portal over time. |
|
Generated By Event Type |
Displays alerts by event type over time. This helps you to understand which event types cause the most alerts. Organisations can use this data to investigate their processes and understand why one event type might be causing more alerts than others. |
|
Generated By Review Status |
Displays alerts by review status during the time interval defined in the filters. This gives a snapshot view of how well the rules and models in =Fraud Transaction Monitoring Portal are performing compared to the assessments made by investigators. The report can be helpful when reviewing false positive rates and identifying potential improvements to risk scoring. |
Generated by Alert Source & Investigator Tab
The Generated by Alert Source & Investigator Tab displays information on alerts generated by assigned investigators and alert source.
The following table describes each of the reports available.
|
Report |
Description |
|---|---|
|
Generated By Assigned Investigator (Top 50) |
Displays the top 50 investigators that closed these alerts generated by Fraud Transaction Monitoring Portal during the time range. This covers alerts generated by Fraud Transaction Monitoring Portal and alerts closed by that investigator. The legend for this chart shows the investigator user names next to a colour block. A block that does not have a name shows alerts that have not been closed. If you require more granularity, use the Data tab or export the content of the page to .csv to analyse the data outside of Fraud Transaction Monitoring Portal. |
|
Generated By Alert Source |
Displays the volume of alerts automatically generated by Fraud Transaction Monitoring Portal models and rules, or manually by the investigator. |
Generated by Status & Solution/Tenant Tab
The Generated by Status & Solution/Tenant Tab displays information on alerts generated by solution/tenants, and alerts generated by status.
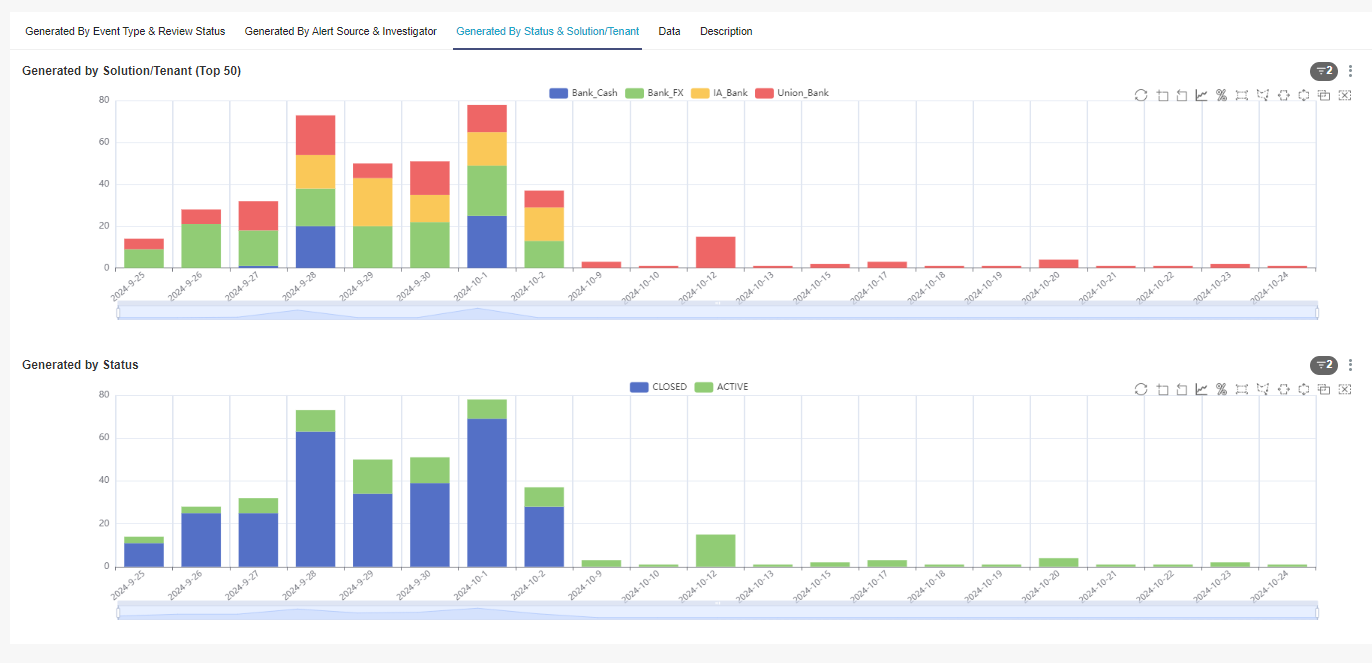
The following table describes each of the reports available.
|
Report |
Description |
|---|---|
|
Generated By Solution/Tenant (Top 50) |
Displays which Solutions or Tenants generated the most alerts (top 50). This report is useful multi-tenancy or multi-solution deployments. |
|
Generated By Status |
Displays the breakdown of the total number of alerts still active or already closed. This chart aggregates all the values from the chart and displays the total across all Tenants and Solutions. By default, all alerts are included in this chart. Use the STATUS option in the Filter menu to specify if you want to see OPEN alerts or CLOSED alerts. When OPEN or CLOSED is applied in the filter, the chart segments the data on REVIEW STATUS. |
Data Tab
The raw data summarised in the Details tab and visualised in the Alert Generated tabs.
Description Tab
Provides a high-level description of the charts and reports.
Alerts Closed
The Alerts Closed reports provide an overview of the alerts closed within the time range selected. This enables a Manager/Supervisor to quickly assess how many alerts have been actioned and closed.
This group of reports is similar to the Alerts Generated reports, but focuses on closed alerts. This report provides an overview of the alerts closed within the time range you selected in the Filter pane. This allows you to quickly assess how many alerts have been actioned and closed. These reports use the alert closed date to plot the data on a timeline.
The time and date associated with the Alerts Closed report are when the alerts were closed. and are not originally generated like in the Alert Count or Alert Generated reports.
Closed by Event Type & Review Status Tab
The Closed by Event Type & Review Status Tab displays information on the total number of alerts closed, the type of event closed and the review status of closed alerts.
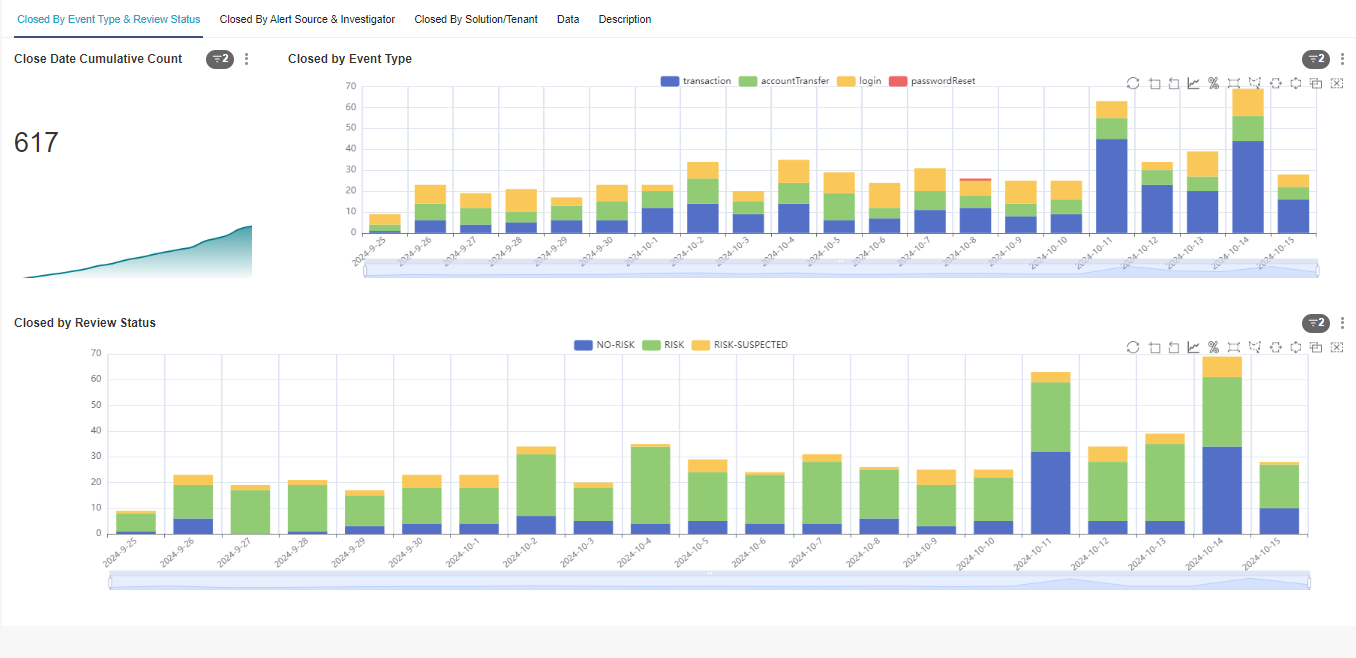
The following table describes each of the reports available.
|
Report |
Description |
|---|---|
|
Close Date Cumulative Count |
Displays the total number of alerts closed in Fraud Transaction Monitoring Portal and a graph with the cumulative count of alerts closed over time. |
|
Closed by Event Type |
Displays alerts that have been closed by event type over time. This helps you to understand which event types cause the most alerts. |
|
Closed by Review Status |
Displays over time all closed alerts within the time period selected in the Filter pane and segments them according to whether they were reviewed as RISK, RISK-SUSPECTED, NO-RISK, or DISCOUNT. This gives a snapshot view of how well the rules and models in Fraud Transaction Monitoring Portal are performing in comparison to the assessments made by human investigators, and can be helpful when reviewing false positive rates and identifying potential improvements to risk scoring. |
Closed by Alert Source & Investigator Tab
The Closed by Alert Source & Investigator Tab displays information on alerts closed by an assigned investigator and alerts closed by their alert source.
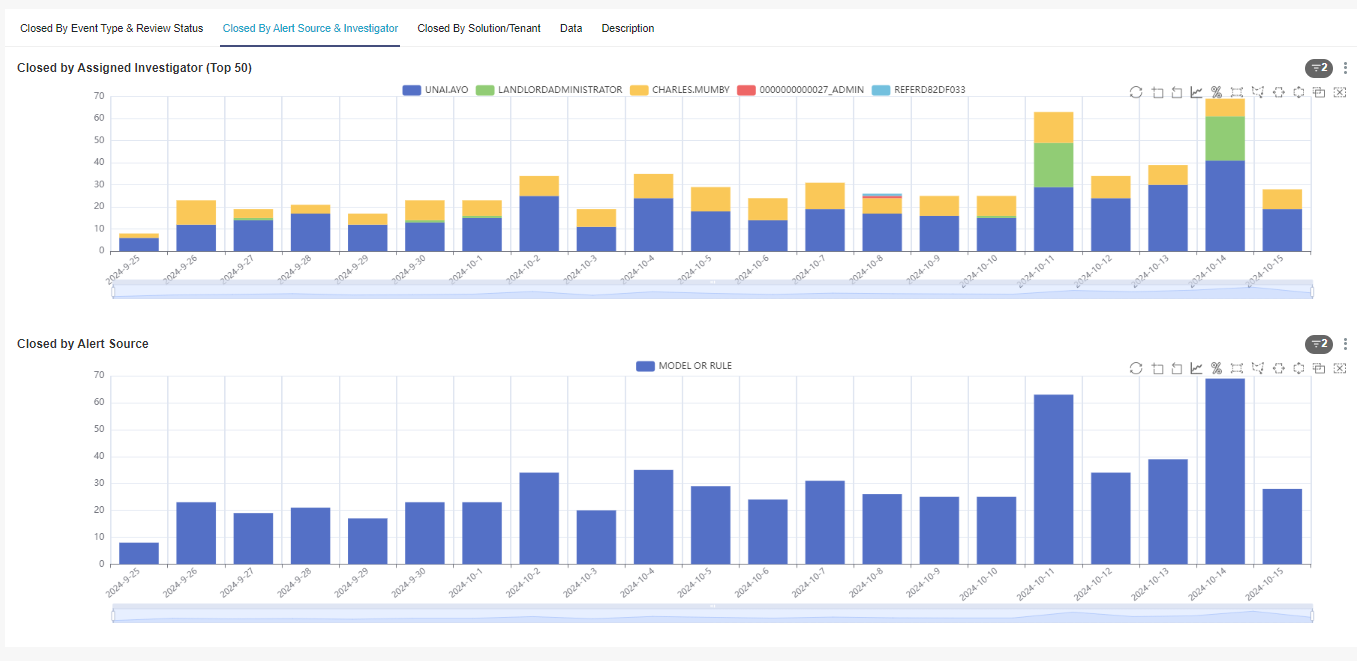
The following table describes each of the reports available.
|
Report |
Description |
|---|---|
|
Closed by Assigned Investigator (Top 50) |
Displays all the alerts closed over time within the time range specified in the filters on the Closed By Alert Source & Investigator tab. The data is ranked by investigator, in order of the number of alerts each investigator has closed in the specified time range. This report allows you to track investigator performance and compare real world close rates to projections, which can help with resource management. If you require more granularity, use the Data tab or export the content of the page to .csv to analyse the data outside of Fraud Transaction Monitoring Portal. |
|
Closed by Alert Source |
Displays the volume of closed alerts automatically generated by Fraud Transaction Monitoring Portal models and rules, or manually by the investigator. |
Closed by Solution/Tenant Tab
The Closed by Solution/Tenant Tab display information on alerts closed by tenants or solutions.
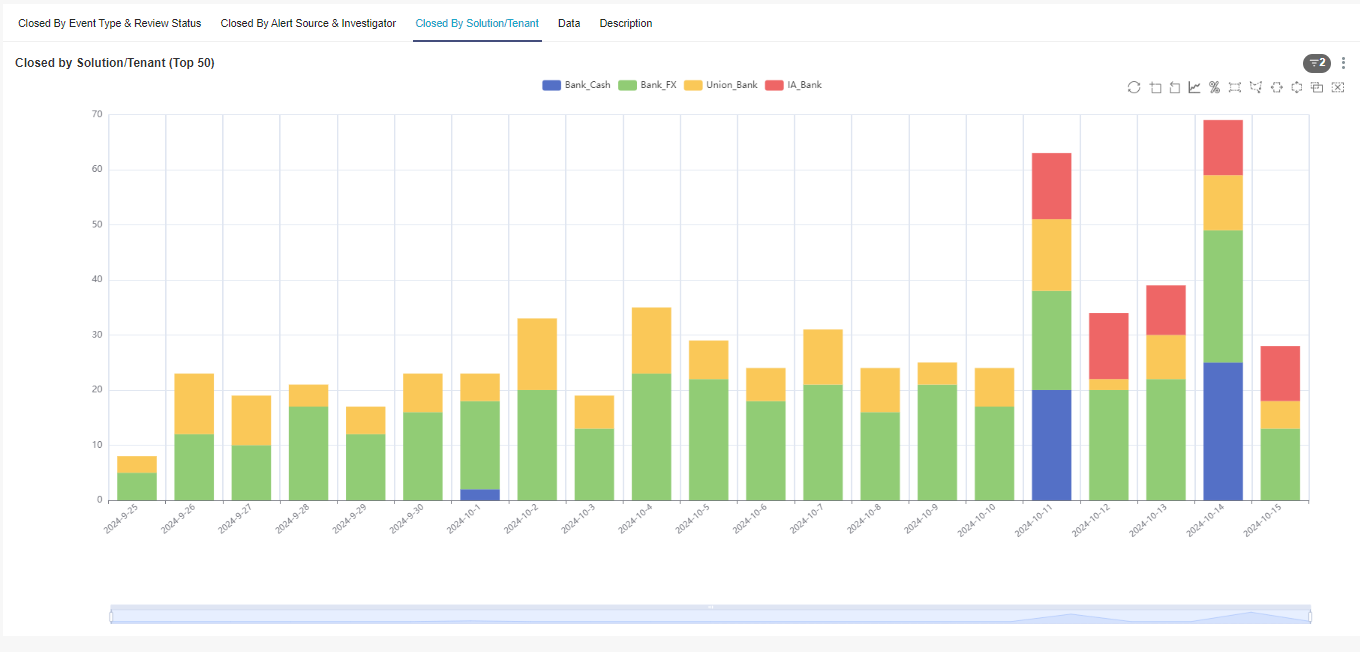
The following table describes each of the reports available.
|
Report |
Description |
|---|---|
|
Closed by Solution/Tenant (Top 50) |
Displays the top 50 tenants or Solutions in terms of the number of alerts each tenant or Solution has closed. If you require more granularity, use the Data tab or export the content of the page to .csv to analyse the data outside of Fraud Transaction Monitoring Portal. |
Data Tab
The raw data summarised in the Details tab and visualised in the Alert Closed tabs.
Description Tab
Provides a high-level description of the charts and reports.
Rules Summary
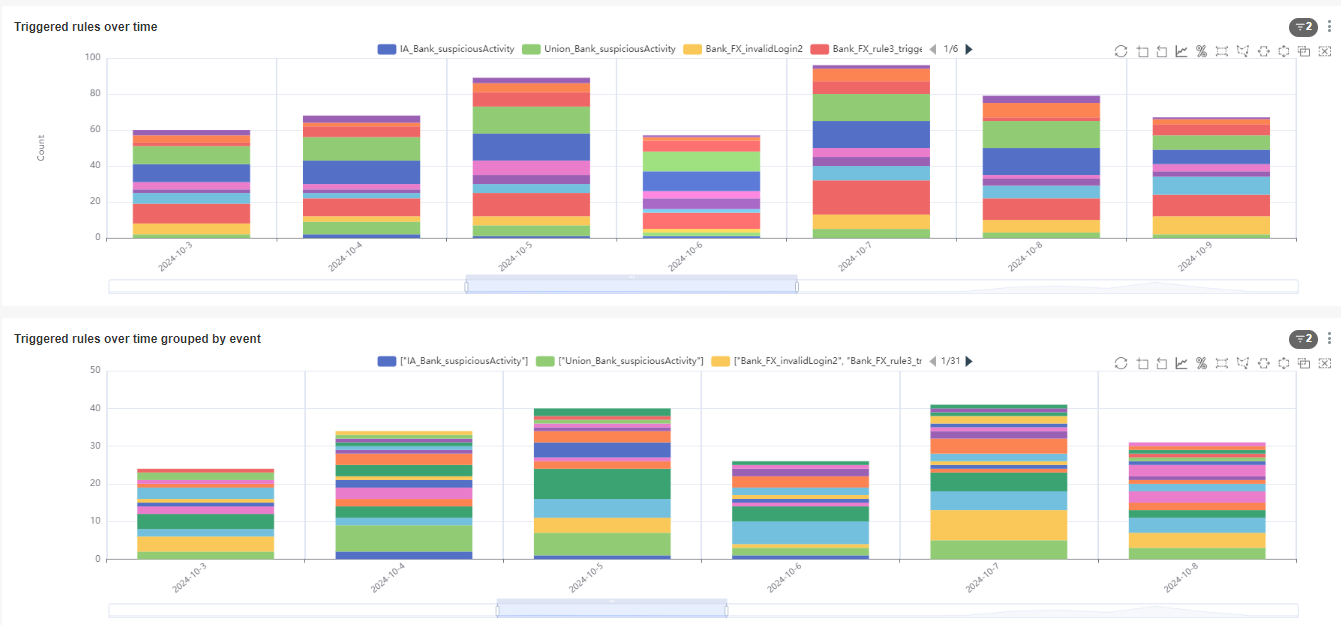
The Rules Summary report shows the number of rules triggered over time, grouped by rule. You can specify the number of rules that are triggered in a specified range, grouped by rule. This enables you to see the volume of rules that have been triggered by events that came into the system.
The following table describes each of the reports available.
|
Report |
Description |
|---|---|
|
Triggered rules over time |
Displays the number of times each rule triggered over time. For example:
|
|
Triggered rules over time grouped by event |
Displays the number of times a group of rules are triggered together. In this chart, an alert where rules A, B and C triggered at the same time would be counted once. An alert where only rules A and B triggered would be another category, and an alert where rule B triggered on its own would be a third category. For example, the following chart extract shows the same data as the 'Triggered rules over time' chart, but grouped by event rather than rule. In this case, the event triggered the same two rules, but Fraud Transaction Monitoring Portal treats the two alerts as a single data point because they were triggered by the same event. |
Model Summary
The Model Summary report provides an overview of model performance across a specified time range. This report enables you to understand how the analytics might change when thresholds are different.
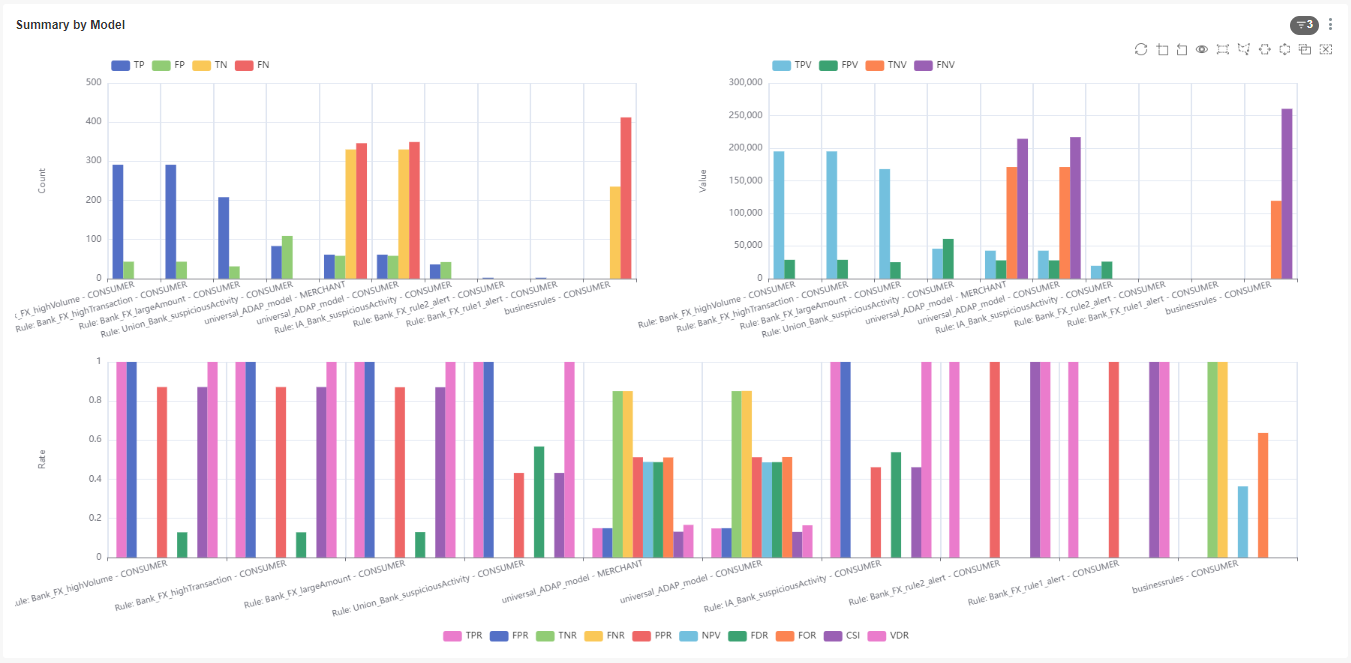
This report shows metrics such as financial value, volumes (counts), and true and false positive rates at a given risk threshold for each rule and model, as follows:
-
TPR (True Positive Rate): Events where the score the model generated is higher than the threshold filter or the business rule has generated an alert. The event is also confirmed as fraud (reviewed as RISK by the analyst or using an external fraud label).
-
FPR (False Positive Rate): Events where the score the model generated is higher than the threshold filter or the business rule has generated an alert, and is reviewed as NO-RISK by the analyst or not decisioned by the analyst. By default, reports assume all events are genuine. This metric is only available for machine learning models, and should be ignored for rules.
-
TNR (True Negative Rate): Events where the score the model generated is lower than the threshold filter and reviewed as NO-RISK by the analyst or still not decisioned by the analyst. By default, reports assume all events are genuine. This metric is only available for machine learning models, and should be ignored for rules.
-
FNR (False Negative Rate): Events where the score the model generated is lower than the threshold filter and the event is confirmed as fraud (reviewed as RISK by the analyst or using an external fraud label). This metric is only available for machine learning models, and should be ignored for rules.
-
PPR (Positive Predictive Rate): Proportion of events identified as fraud/crime by the model that were actually fraud or crime.
-
NPV (Negative Predictive Value): Proportion of events identified as genuine activity by the model that were actually genuine. This metric is only available for machine learning models, and should be ignored for rules.
-
FDR (False Discovery Rate): Proportion of events identified as fraud/crime by the model that were incorrectly classified (actually genuine).
-
FOR (False Omission Rate): Proportion of events identified as genuine by the model that were incorrectly classified (actually fraud/crime). This metric is only available for machine learning models, and should be ignored for rules.
-
CSI (Critical Success Index): Number of events correctly identified as fraud/crime as a fraction of the number of events classified as fraud/crime plus the number of missed cases of fraud/crime. This metric is only available for machine learning models, and should be ignored for rules.
-
VDR (Value Detection Rate): Proportion of fraud/crime correctly identified by the model by transaction value. This metric is only available for machine learning models, and should be ignored for rules.
-
TP (True Positive) count and value: Count and value of fraud/crime correctly identified as fraud/crime (the score the model generated was higher than the threshold defined in the filter or the rule alerted).
-
FP (False Positive) count and value: Count and value of genuine events incorrectly identified as fraud/crime (the score the model generated was higher than the threshold defined in the filter or the rule alerted).
-
TN (True Negative) count and value: Count and value of genuine events correctly identified as genuine (the score the model generated was lower than the threshold defined in the filter). This metric is only available for machine learning models, and should be ignored for rules.
-
FN (False Negative) count and value: Count and value of fraud/crime incorrectly identified as genuine (the score the model generated was lower than the threshold defined in the filter). This metric is only available for machine learning models, and should be ignored for rules.
To use this report, you must select a rule or model using the Model filter. If your model outputs a score, set the threshold appropriately. The report shows the different analytics metrics, based on the assumption that any event that scored above the threshold you set generated an alert.
TP/FP Over Time
The Time Summary by Model report provides an overview of the analytics reports, showing values, volumes and rates through time, across all analytics measurements.
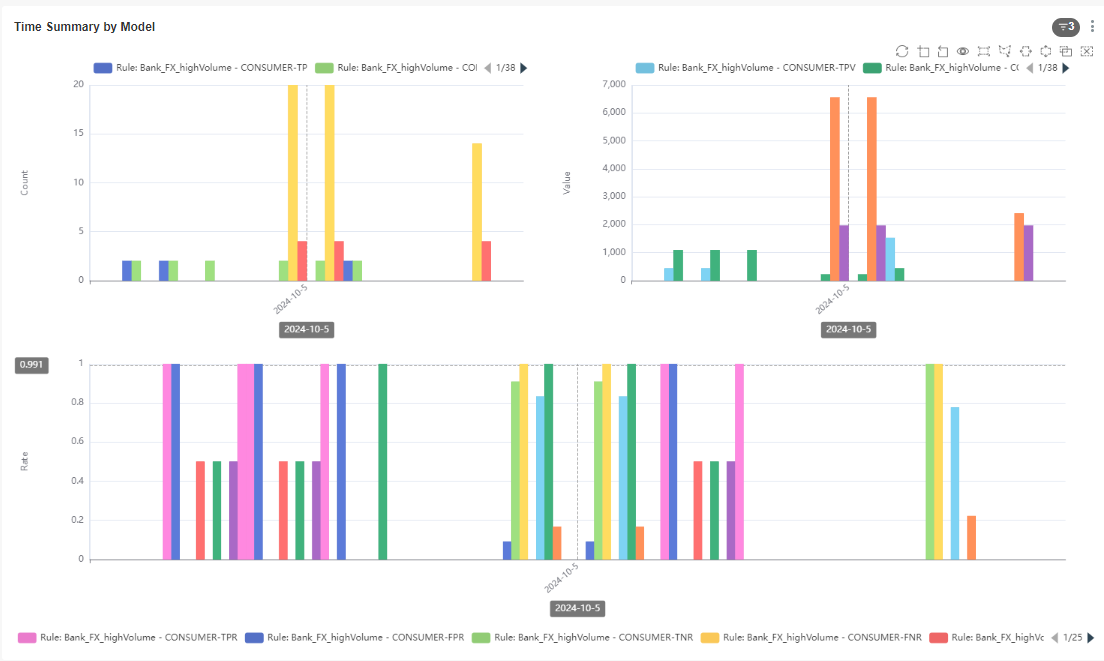
It is broken down as follows:
-
TPR (True Positive Rate): Events where the score the model generated is higher than the threshold filter or the business rule has generated an alert. The event is also confirmed as fraud (reviewed as RISK by the analyst or using an external fraud label).
-
FPR (False Positive Rate): Events where the score the model generated is higher than the threshold filter or the business rule has generated an alert, and is reviewed as NO-RISK by the analyst or not decisioned by the analyst. By default, reports assume all events are genuine. This metric is only available fo r machine learning models, and should be ignored for rules.
-
TNR (True Negative Rate): Events where the score the model generated is lower than the threshold filter and reviewed as NO-RISK by the analyst or still not decisioned by the analyst. By default, reports assume all events are genuine. This metric is only available for machine learning models, and should be ignored for rules.
-
FNR (False Negative Rate): Events where the score the model generated is lower than the threshold filter and the event is confirmed as fraud (reviewed as RISK by the analyst or using an external fraud label). This metric is only available for machine learning models, and should be ignored for rules.
-
PPR (Positive Predictive Rate): Proportion of events identified as fraud/crime by the model that were actually fraud or crime.
-
NPV (Negative Predictive Value): Proportion of events identified as genuine activity by the model that were actually genuine. This metric is only available for machine learning models, and should be ignored for rules.
-
FDR (False Discovery Rate): Proportion of events identified as fraud/crime by the model that were incorrectly classified (actually genuine).
-
FOR (False Omission Rate): Proportion of events identified as genuine by the model that were incorrectly classified (actually fraud/crime). This metric is only available for machine learning models, and should be ignored for rules.
-
CSI (Critical Success Index): Number of events correctly identified as fraud/crime as a fraction of the number of events classified as fraud/crime plus the number of missed cases of fraud/crime. This metric is only available for machine learning models, and should be ignored for rules.
-
VDR (Value Detection Rate): Proportion of fraud/crime correctly identified by the model by transaction value. This metric is only available for machine learning models, and should be ignored for rules.
-
TP (True Positive) count and value: Count and value of fraud/crime correctly identified as fraud/crime (the score the model generated was higher than the threshold defined in the filter or the rule alerted).
-
FP (False Positive) count and value: Count and value of genuine events incorrectly identified as fraud/crime (the score the model generated was higher than the threshold defined in the filter or the rule alerted).
-
TN (True Negative) count and value: Count and value of genuine events correctly identified as genuine (the score the model generated was lower than the threshold defined in the filter). This metric is only available for machine learning models, and should be ignored for rules.
-
FN (False Negative) count and value: Count and value of fraud/crime incorrectly identified as genuine (the score the model generated was lower than the threshold defined in the filter). This metric is only available for machine learning models, and should be ignored for rules.
To use this report, you must select a rule or model using the Model filter. If your model outputs a score, set the threshold appropriately. The report shows the different analytics metrics, based on the assumption that any event that scored above the threshold you set generated an alert.