Sandbox Replay
Sandbox Replay allows users to test the effects of changes made to analytics in the staging environment. This feature lets you see how a new analytics configuration would have performed over a selected historical period (for example, over the past 30 days), compared to how the live system performed over the same period. Tests carried out in Sandbox Replay do not affect the live environment.
Users must have the Sandbox Replay permission to use the Sandbox Replay functionality. Contact your Account Manager to purchase the option.
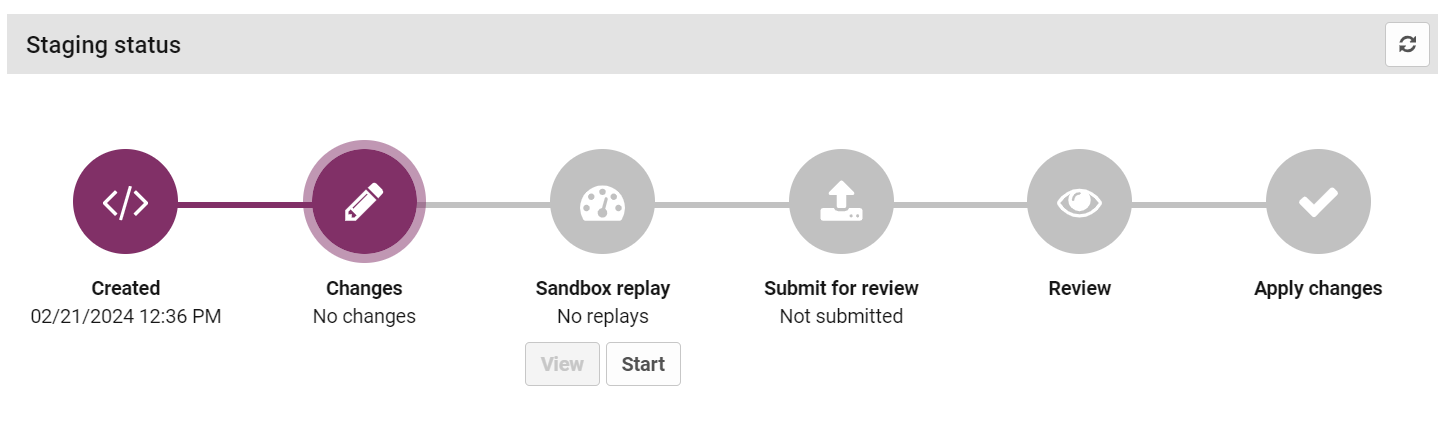
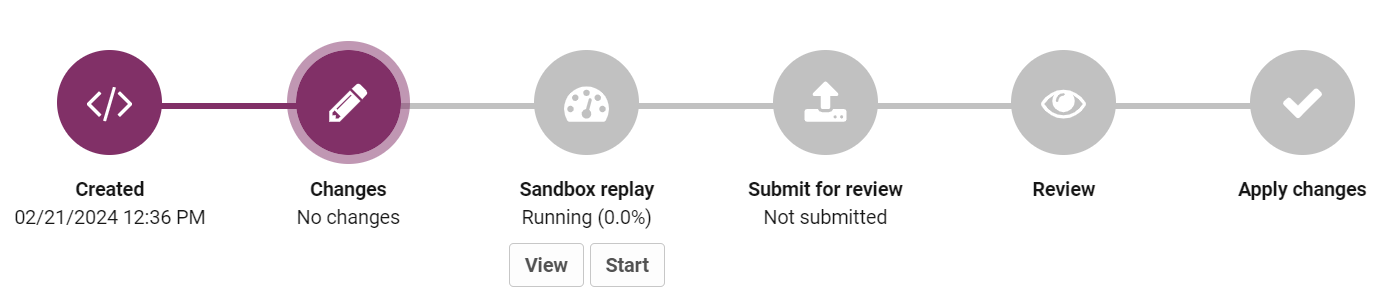
The Sandbox Replay icon displays the running Sandbox Replays for your analytics version. This is usually the staging version, which contains the changes that you might want to test before submitting for approval. Below the Sandbox Replay icon, you can see the status of any replays that have been run or are currently running.
-
No Replays indicates that no replays have yet been run for this particular analytics version.
-
Pending indicates that a Sandbox Replay has been configured and created, but is waiting for the relevant service to become available before it can be run. When the service becomes available the status changes to 'Claimed'.
-
Claimed indicates that a Sandbox Replay has been started, and the relevant service is ready to run it. When the Sandbox Replay is running, the status changes to 'Running'.
-
Running indicates that a Sandbox Replay is being run, and the percentage completion is shown to indicate the progress of the replay. When the replay is complete, the status changes to 'Completed'.
-
Completed (Up-to-date) indicates that there is at least one completed Sandbox Replay for the analytics version you are viewing (usually the staging environment). 'Up-to-date' indicates that this completed replay used the up-to-date configuration for this version.
-
Completed (Out of date) indicates that changes have been made to this analytics version since the replay was run.
Create a Sandbox Replay
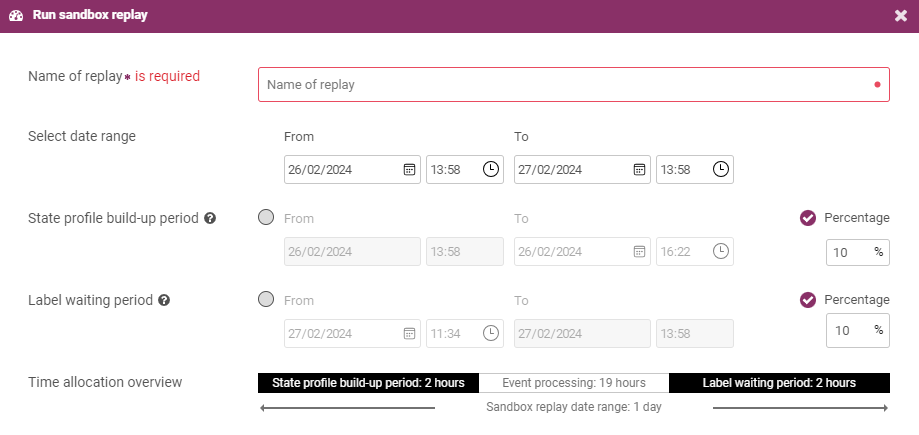
When creating a new Sandbox Replay, you need to specify options that determine how the replay is run, the time period it applies to, and other parameters that can have a significant effect on how long the replay takes to run.
The fields available in the window are detailed in the table below:
|
Option |
Description |
|---|---|
|
Date Range |
The date range to consider when running the replay. Events between the start and the end date are processed when running the replay (however, not all events in this period may be processed). |
|
State profile build-up period |
A Sandbox Replay starts with no behavioural profile data. Starting with no behavioural data ensures that business rules that make use of behavioural profiles deliver more accurate and less misleading results. The state profile build-up period is a period at the beginning of the replay that allows behavioural profile data to build up for the related entities. No alerts are created during this period as none of the authorisations are assessed for fraud. Authorisations are only assessed after the state profile build-up period and before the label writing period. |
|
Label waiting period |
The label waiting period allows for label events |
|
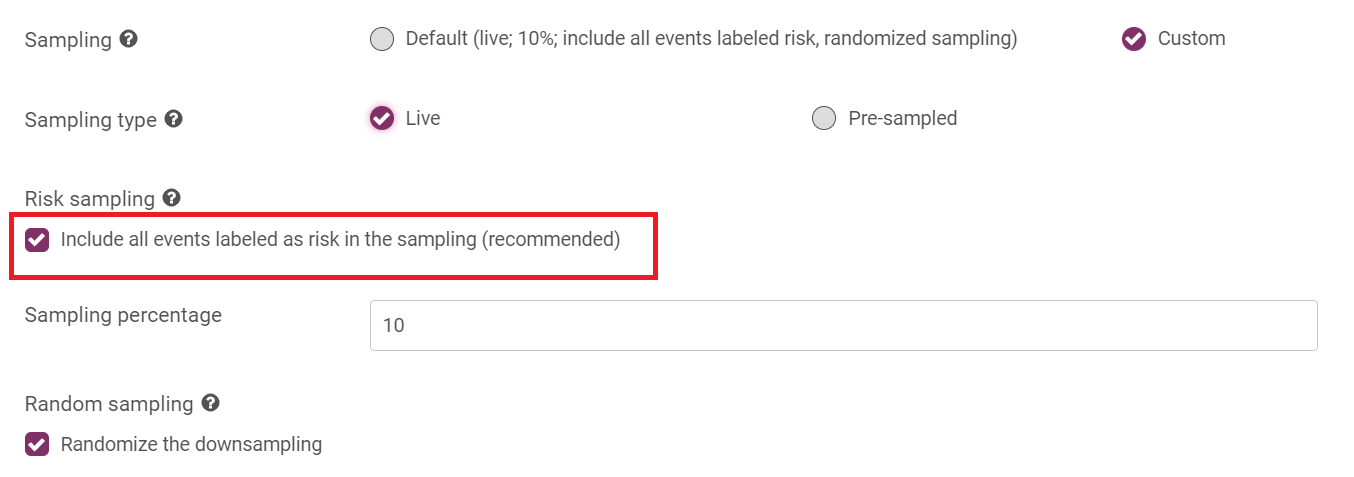
Sampling type |
In a production environment, a large number of events is typically ingested and processed by the system over the duration of a Sandbox Replay. Using all of these events when running a replay would result in a very long processing time, so Sandbox Replay uses downsampling to reduce the number of events that must be processed. It does this by randomly selecting a percentage of entities of a given type and processing all events from the selected time range that contain those entities. There are two sampling approaches that you can select:
|
|
Entity type |
(Live sampling only): The entity type to select the sample from. |
|
Risk sampling |
(Live sampling only): If you choose to include all events marked as risk in the sample, all entities of the selected type associated with events marked as 'risk' are included in your replay. That includes events labeled as 'risk' by user alert reviews, or by known fraud data such as chargebacks or confirmed fraud reports. |
|
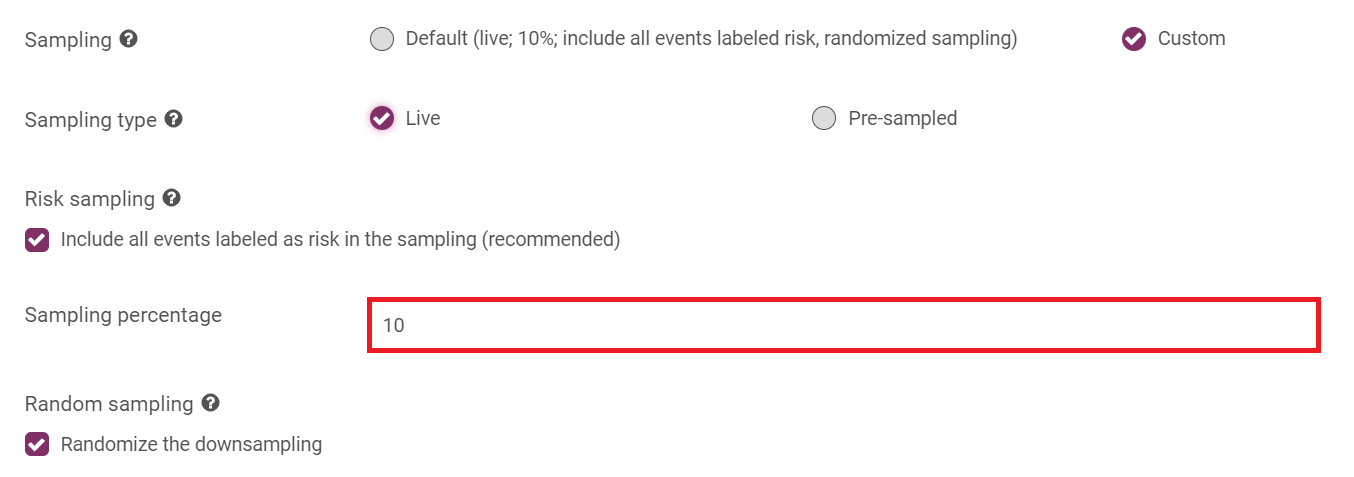
Sampling percentage |
(Live sampling only): The percentage of entities that are selected at random to run your changes against. If you choose to include all events marked as 'risk', all entities with an event labeled as 'risk' are included in the sample, combined with randomly-selected entities to make the number up to the selected percentage. The higher the percentage, the longer it can take to run your replay. The time taken to run the replay depends on how many events occurred in this period, and how many analytics changes are being tested. |
|
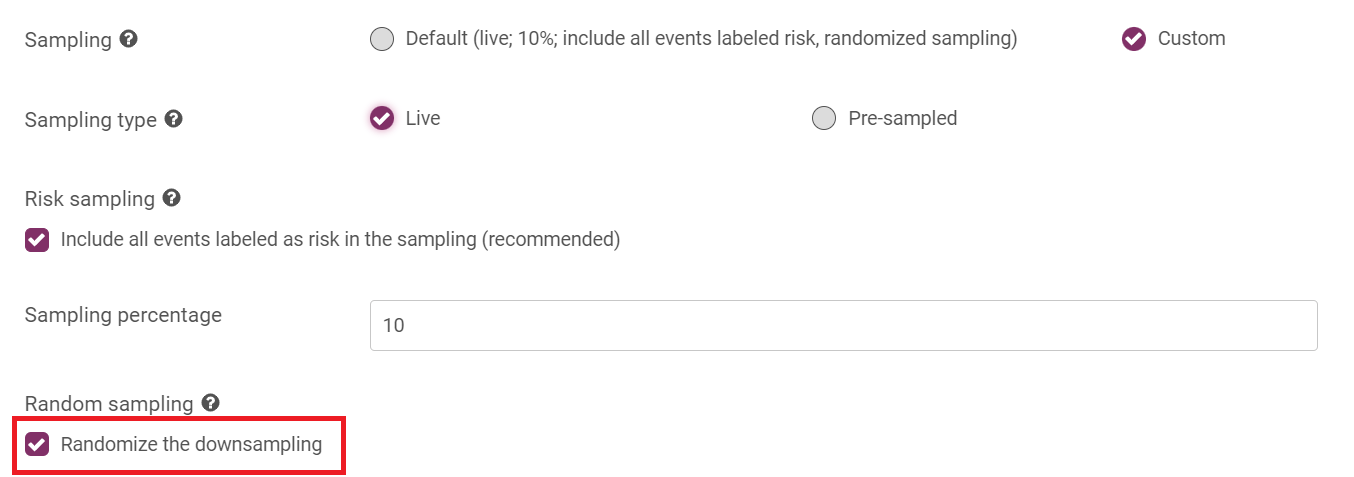
Random sampling |
(Live sampling only): If you choose to randomize your sample, a different random sample of entities are selected each time you run a replay. Otherwise, the same sample of entities are used each time you run a replay over the same time period. |
Create a Replay
To create a replay:
-
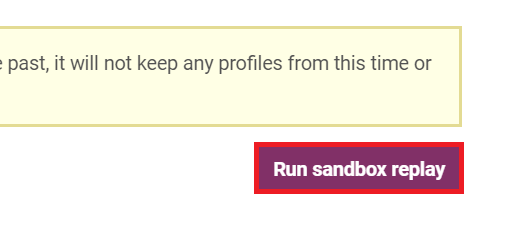
Click Start under the Sandbox Replay icon to open the Run Sandbox Replay window.
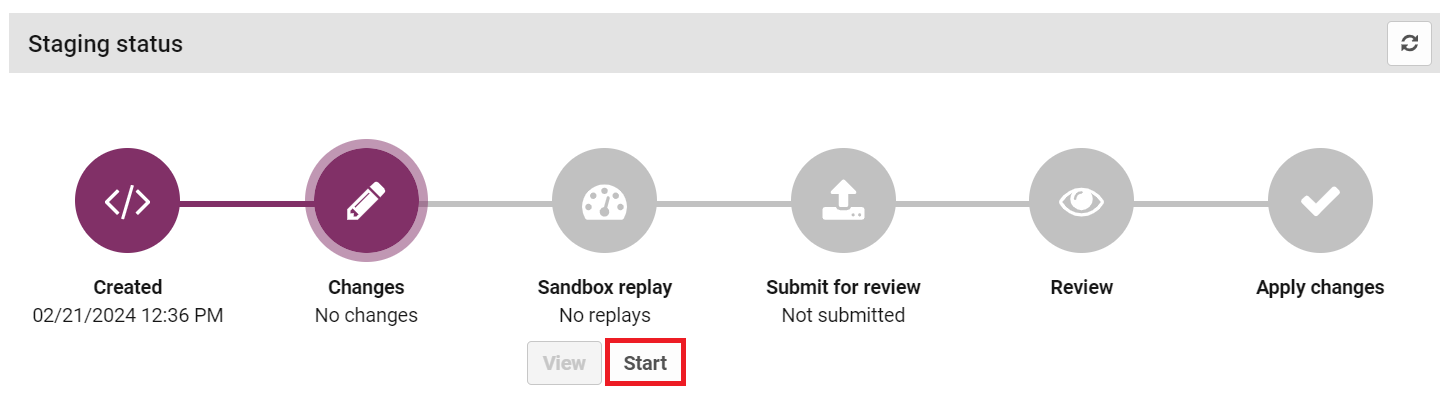
The Run Sandbox Replay window opens.
-
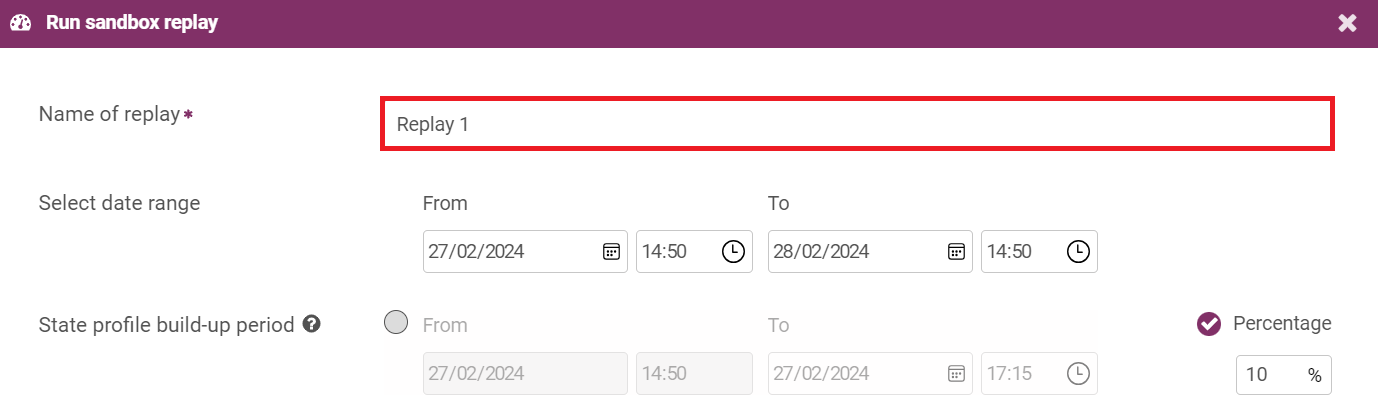
Enter the name of the new replay in the Name of Replay field.
-
Select a date range for the replay using the From and To date fields. Clicking on the downwards arrow to the right of the box displays a calendar where you can select your start date. You can perform the same action for the end date.

-
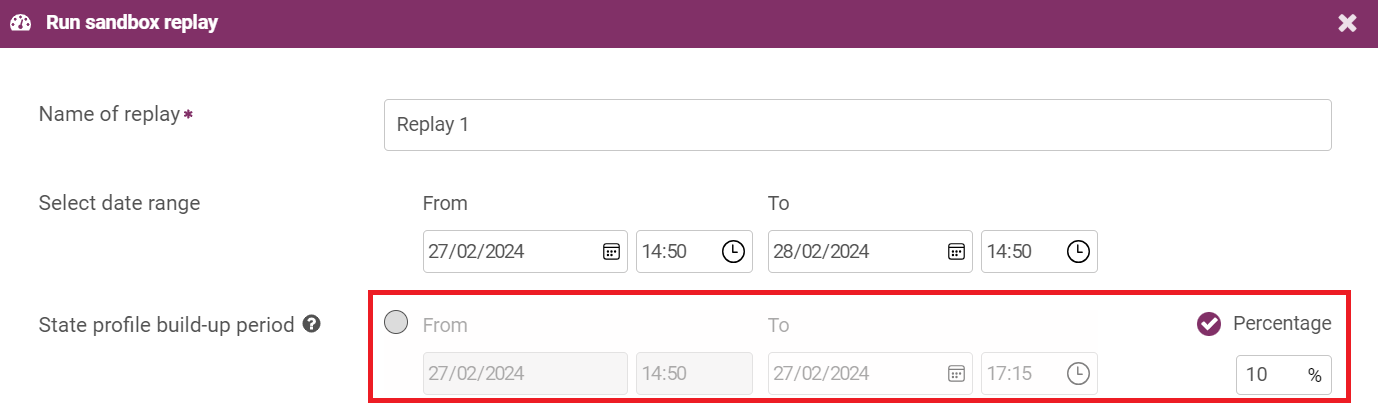
Define the length of the state profile build-up period at the start of the replay as either:
-
Enter a percentage of the replay period or leave the length as the default of 10%.
-
Select the check-circle beside 'From' and select a specific date and time at which to end the state profile build-up period.
-
-
Define a label waiting period at the end of the replay as either:
-
Enter a percentage of the replay period or leave the length as the default of 10%; or
-
Select the check-circle beside 'From' and select a specific date and time at which to end the label waiting period.
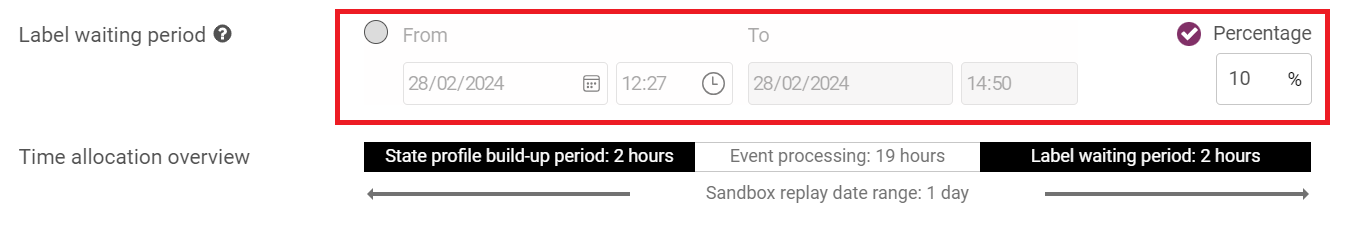
The time allocation overview below these sections indicates:
-
The total date range of the replay.
-
The length of the state profile build-up and label waiting periods.
-
The length of the period between these in which analytics results are quantified and compared.
-
-
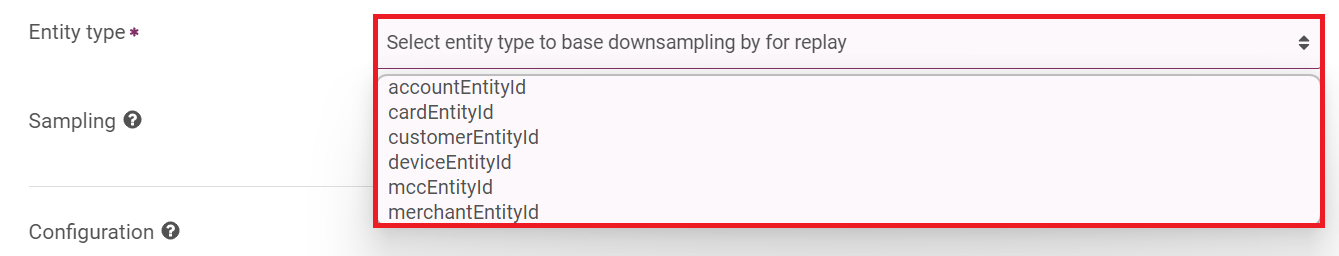
Select the entity type the replay runs for from the drop-down menu.
-
Select the sampling type as either:
-
Default (live, randomized sampling with a 10% sample size, including all events labeled as 'risk'.); or
-
Custom. Selecting this option displays the Sampling Type Live and Pre-sampled fields
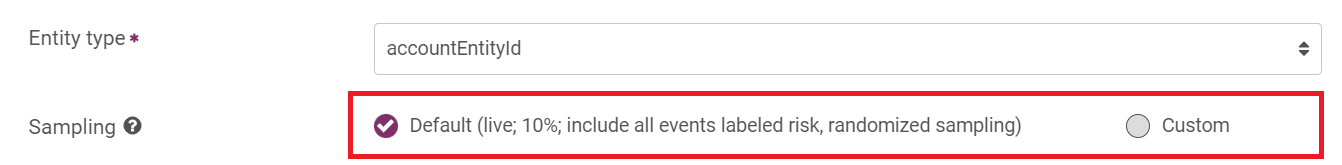
We highly recommend using the Default option. The custom option can include accessing hundreds of thousands of authorisations which can lead to a long assessment.
-
-
If you selected live sampling, set the parameters that determine how entities are sampled:
-
Select the 'Risk sampling' check box to include all events labelled as 'risk' in the sampling (this is the default), or clear the check box to sample entities randomly across the whole population.
-
Select a sampling percentage (the percentage of entities that are selected).
-
Select the 'Random Sampling' check box if you want a new random sample of entities to be selected each time you run the replay (this is the default).
-
-
Enable or clear the Configuration checkbox to include all or specific analytics from staging.
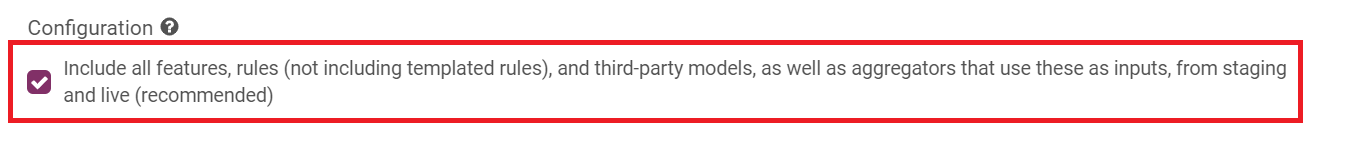
You can use the tabs and check boxes to manually select the analytics you want to include.
-
Click Run Sandbox Replay.
The Sandbox Replay status changes to ‘Pending’. The Sandbox Replay window, and the Sandbox Replay icon in the analytics configuration workflow, shows the progress of your replay.
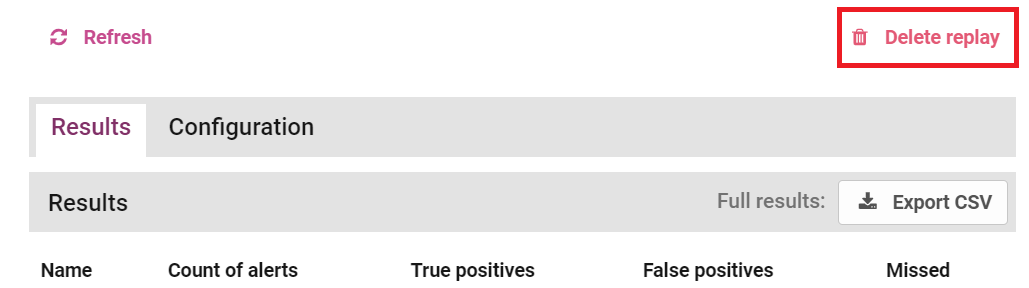
View Sandbox Replay Results
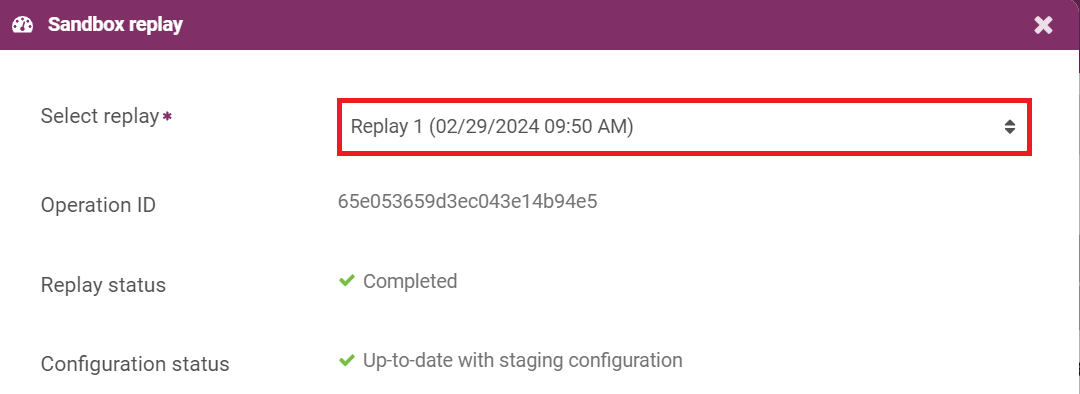
When the replay has finished, click View below the Sandbox Replay icon on the Analytics Status page to see your results. The most recent replay appears first. To see the results of older replays, select the replay you are interested in from the "Select Replay" drop-down at the top of the results window.
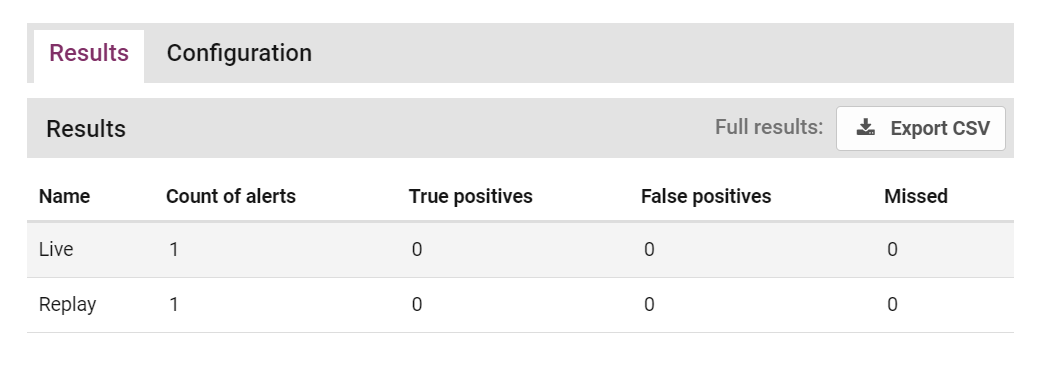
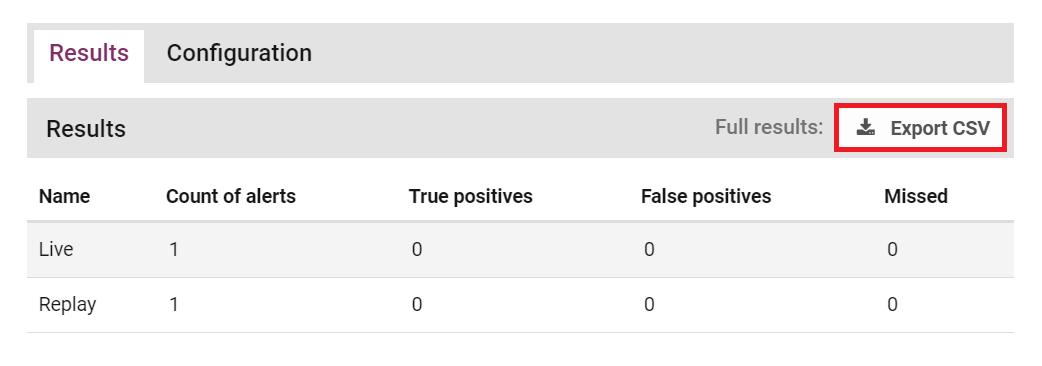
The 'Results' tab displays the count of alerts that would have triggered in both the Live and Staging (Replay) environment with your new configuration, as well as:
-
True Positives: Alerts that were reviewed as risk or events that were automatically flagged as high risk (e.g. confirmed fraud).
-
False Positives: Alerts generated by genuine transaction.
-
Missed: Events labeled as 'risk' that did not generate alerts (also known as a false negatives).
You can export results as a CSV file by clicking Export CSV. This file includes a detailed summary of every incident generated by the live analytics configuration during the time window selected, and incidents that would have been generated by the staging configuration. These include entity details, risk scores, and a list of rules that (would have) triggered and tags that have been assigned.
If results are not conclusive, or you want to run the replay again with new configuration, the replay can be deleted by clicking Delete Replay.