Incident Review Page
The Incident Review page enables you to view more details and perform actions on an incident.
Depending on your permissions and your configuration, you can use the Incident Review page for different tasks:
-
Investigate the details of an incident and classify it as either Risk or No Risk
-
Add an incident to the Pending list.
-
Add the entity involved (or other data from events in that entity's history) to a list such as a negative list or watch list.
-
Refer incidents to a user or team.
The top of the Incident Review page shows details of the entity involved in the incident you are viewing. This includes the entity ID, and entity type (top left). On the right, there is a review timer that shows you how long you have been viewing the incident.
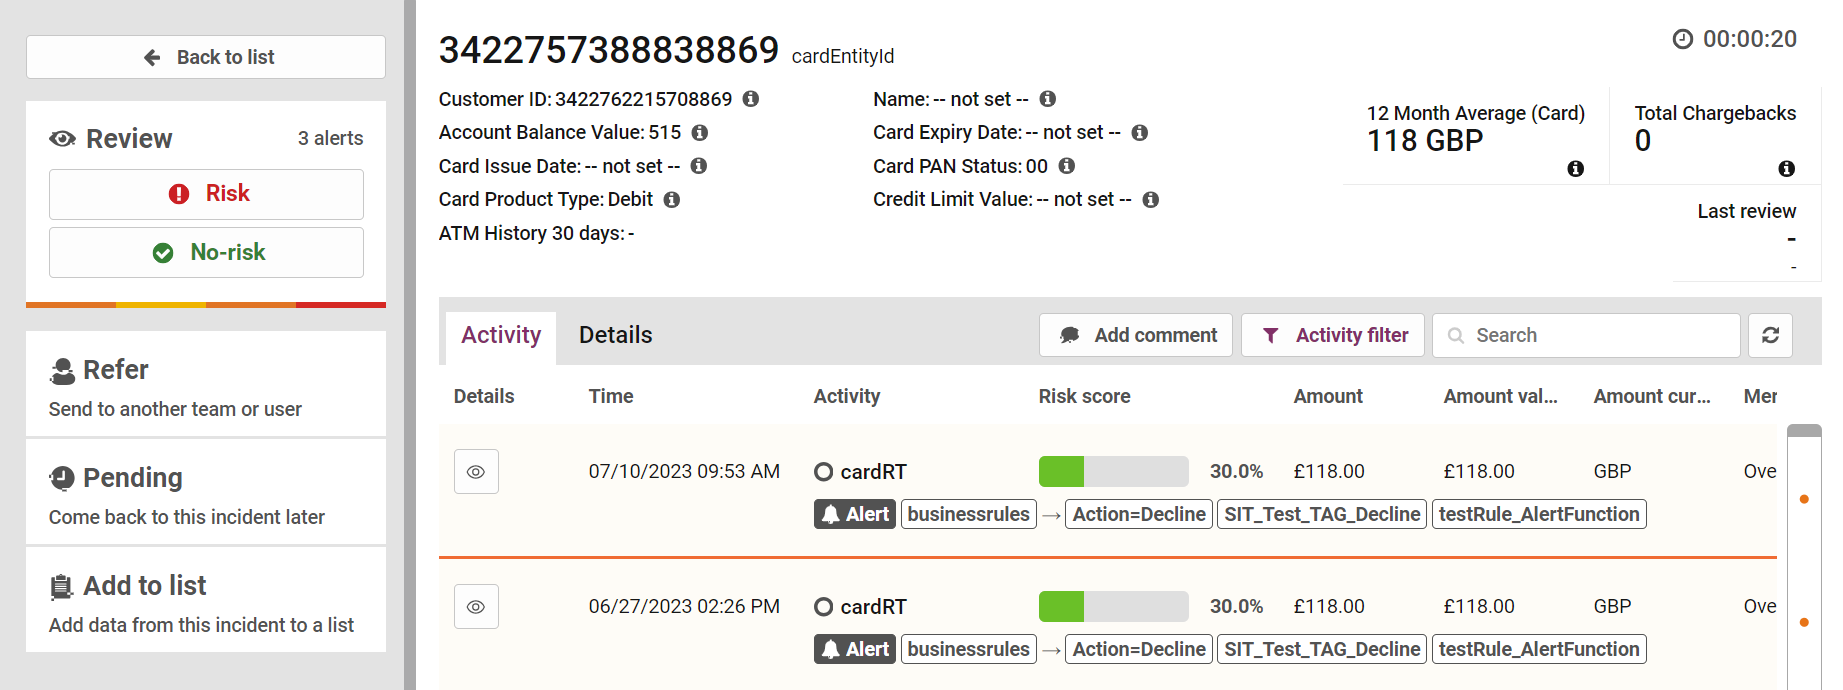
Figure 13: Incidents Review Page
Below the entity ID and type, there are two areas that may display information about the relevant entity: the entity details on the left and the entity headlines on the right. By default, no details are displayed in the entity details area. However, your portal system may be configured to show information drawn from the entity's behavioral profile data, or from other entity data stored by the portal.
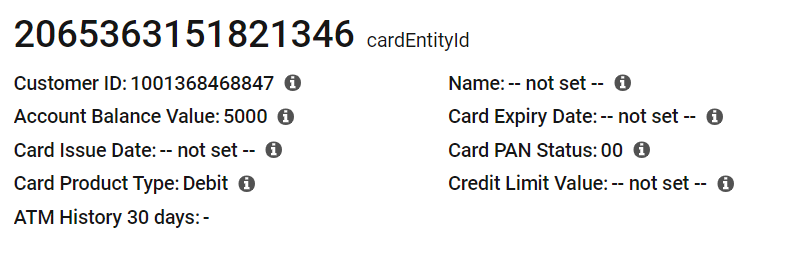
Figure 14: Incident Entity Details
Below the entity details section, the main part of the Incident Review page is split into tabs:
-
The Activity tab shows a timeline of the entity's history, including events, alerts and analyst actions (see Activity Tab)
-
The Details tab shows a summary of the entity's history (see Details Tab)
Depending on how the portal is configured, some confidential or personal data displayed in the Incident Review page may be hidden or partially hidden.
Activity Tab
The Activity tab shows a timeline of the events generated by the relevant entity. For each event in the timeline, one or more of the following columns are shown:
-
Time: the date and time the event took place
-
Event: details of the event itself, including the event type
-
Risk/Scam score: for events that were scored by a model or rules, the risk (for fraud events) or Scam Transaction Monitoring (for scam events) score for that event
Scam Transaction Monitoring is an optional feature which analyses transactions for potential scam events. For information on setting up and using Scam Transaction Monitoring , either speak to your account manager or see the Scam Transaction Monitoring Guide.

Figure 15: Incident Activity Tab
Additional columns containing more information about the events can also be displayed.
By default, the timeline includes events that generated alerts together with all analyst actions (such as reviews and comments). To change which events are included in the timeline, at the top of the timeline, click the Activity Filter button(see Filtering the activity timeline).
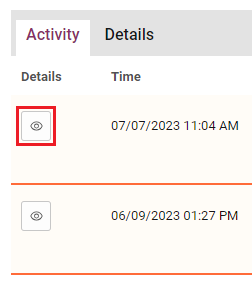
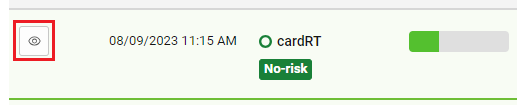
When an analyst takes action on an incident, it is shown in the activity timeline. The date and time and type of the action are shown, along with the analyst's name and any comment they added. The full comment and other details of the activity can be viewed in the sidebar by clicking the Eye icon to the left of the date.
From the Activity tab, you can:
-
Click the Eye icon to view more information about an event select an event in the timeline
-
Add a comment to the incident, click (see Adding a comment)
-
Click the Refresh button to refresh the incident timeline so that it shows the latest events
Filtering the Activity Timeline
You can use the filter options to select what kind of events are included in the event timeline, such as events that did not generate an alert, alerts that have been reviewed, analyst actions, or specific event types, such as transactions. To filter the activity timeline:
-
Click the Activity Filter button at the top of the activity timeline. The filter panel will open.
-
Use the four buttons on the left of the filter panel to select which statuses of events you want to see. The options available are:
-
Unreviewed alerts
-
Reviewed as risk
-
Reviewed as no-risk
-
Non-alerted
If you do not select any of the available statuses, all event types are included in the timeline.
-
-
Select the types of events that you want to see from the middle panel. Click All to select all event types, or None to clear the selection of all event types. Event types present in the activity timeline of the relevant entity are highlighted in bold.
If you do not select any event types, all event types are included in the timeline.
-
Select the types of analyst actions you want to see in the right filter panel, such as Alert review, Add comment, or Refer.
If you do not select any analyst action types, all action types are included in the activity timeline.
-
Click the Activity Filter button to close the filter panel to save the filter changes.
The changes you make to the filter options are retained when you view another incident. The changes are also retained the next time you log in to the portal.
To export a record of user activity associated with this entity in PDF format, click the Export Selected Actions (.pdf) button below the Analyst actions on the left of the filter panel. This will export only the types of analyst action that are currently visible.
Resetting the Activity Filter
To reset the activity filter:
-
Click the Activity Filter button at the top of the activity timeline.
-
Click the Reset Filter button at the bottom right of the filter panel.
The timeline return to showing all events that generated alerts and all analyst actions.
Searching the Activity Timeline
Use the search box to search, filter, or highlight the events included in the event timeline. This will search across all columns in the activity timeline.
Activity Types
When the timeline is too large to fit in your browser window, a scrollbar is displayed on the right of the timeline. Dots at regular intervals on the scrollbar represent each activity in the timeline. The dots are colour-coded as shown below:
|
Dot |
Description |
|---|---|
|
|
Event that did not generate an alert. |
|
|
Unreviewed alert. |
|
|
Alert reviewed as ‘No Risk’. |
|
|
Alert reviewed as ‘Risk’. |
|
|
Analyst action such as a comment, manual alert creation, or referral. |


Details Tab
The Details tab contains detailed information relating to the entity in the current incident.
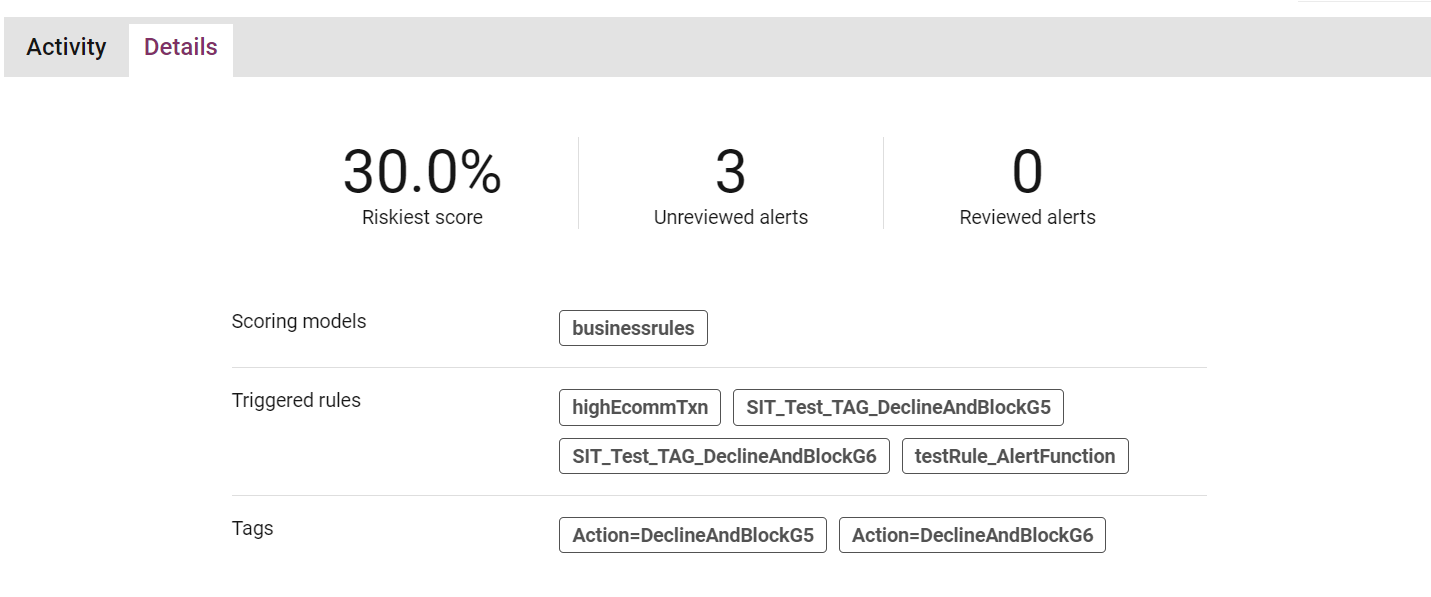
Figure 16: Details Tab
The top panel displays the following information:
-
Riskiest Score: the highest risk score assigned to an alert generated by this entity.
-
Unreviewed Alerts: the number of outstanding alerts in this incident.
-
Reviewed Alerts: the number of alerts for this entity already reviewed in this incident.
-
Scoring Models: the models which have scored events related to this entity.
-
Triggered Rules: the rules which have triggered for this entity.
-
Tags: the tags which have been output by models/rules for this entity.
Events Score Distribution and Event/Alerts Breakdown
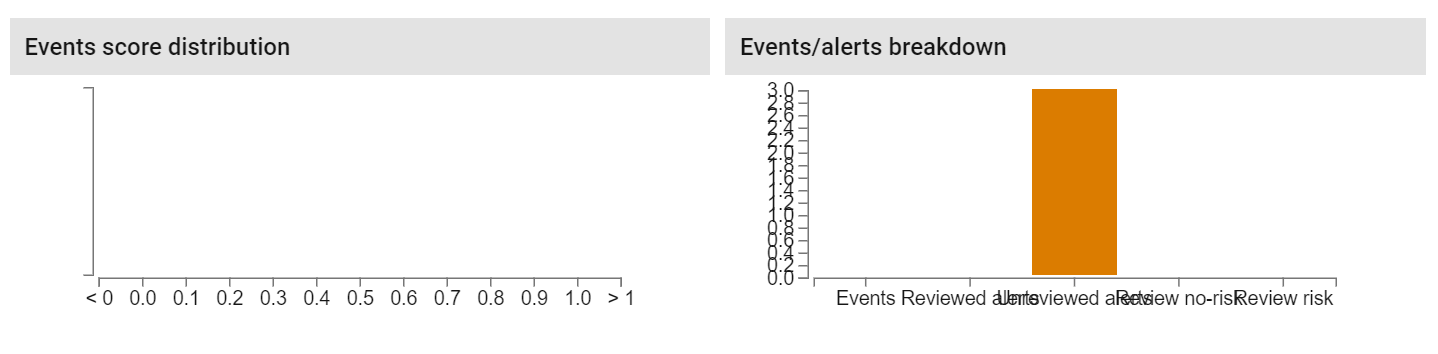
Figure 17: Events score distribution and breakdown section
The Events Score histogram displays the distribution of risk scores for events relating to the current entity.
The Events/Alerts Breakdown histogram displays:
-
All Events: the total count of events for the current entity.
-
Reviewed Alerts: the count of alerts which have been previously reviewed.
-
Unreviewed Alerts: the count of outstanding unreviewed alerts.
-
Review No-risk: the count of alerts reviewed as 'No risk' for this entity.
-
Review Risk: the count of alerts reviewed as 'risk' for this entity.
Business Rule Profile
Profile data stored for this entity is displayed in two columns: the left column indicates the name of the variable (i.e. the AMDL state expression). The right column displays the stored data. This data may be one of the following types, as indicated by the icon to the left of the variable name
-
Number
-
String (this includes timestamp data)
-
Boolean (true or false)
-
Collection of multiple values
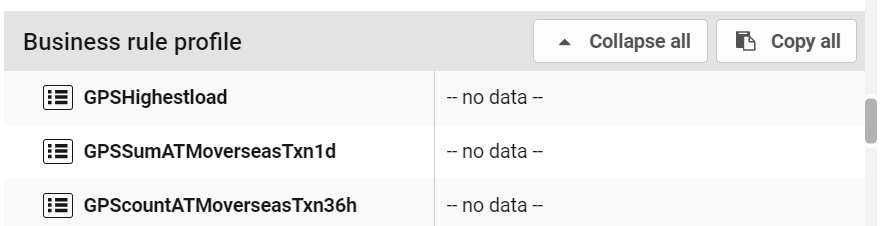
Figure 18: Business rule profile section
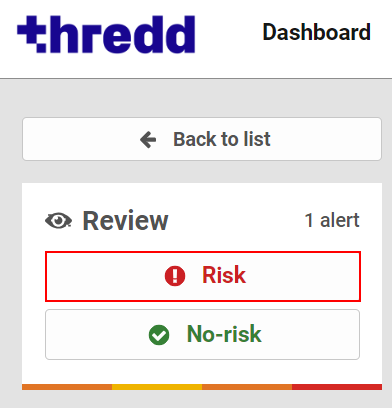
Reviewing Incidents
Incidents can be reviewed based on entity behavior, applying a decision to one or more unreviewed alerts. Incidents are usually reviewed from the 'Open' incident list, but reviewing is also possible for 'Pending' incidents.
Not all users will have the appropriate permissions to review incidents. Users with a read-only role or read-only permissions will see a message in the sidebar stating they do not have permission to action incidents, instead of the review panel.
Using the current and past behaviour information presented in the Incident Review page, analysts can assign a decision to the incident, identifying the entity’s behaviour as high or low risk.
Reviewing alerts also provides feedback to any Adaptive Behavioral Analytics models, allowing them to learn from user decisions. Review decisions are assigned, and other actions can be taken, using the sidebar that appears to the left of the Incident Review page.
Reviewing All Alerts as Risk
To review all the unreviewed alerts in an incident as ‘Risk’:
-
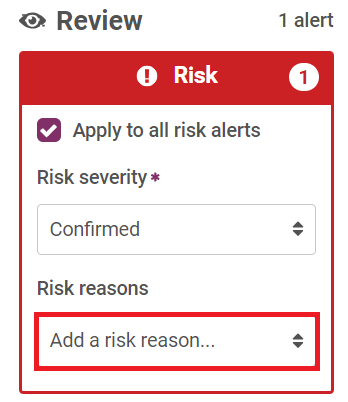
Click the Risk button in the sidebar of the Incident Review page. The Risk review panel appears in the sidebar.
-
Either:
-
Assign a risk severity (confirmed or suspected) to all the alerts in the incident by selecting it from the Risk Severity drop-down list.

or
-
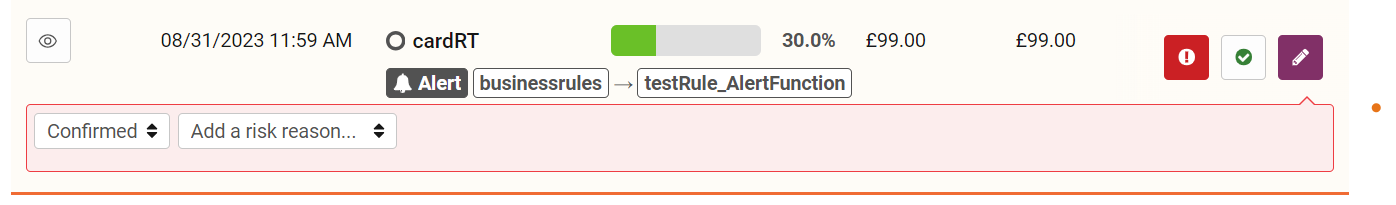
Assign risk severities to the individual alerts by clearing the 'Apply to all Risk alerts' check box or clicking the button next to one of the alerts, and then selecting confirmed or suspected from the left drop-down menu beneath each alert.
-
-
Either:
-
Select one or more Risk reasons explaining your decision from the Risk Reasons drop-down list in the sidebar – these will apply to all alerts in the incident.
The Risk reasons assigned to this incident appear beneath the 'Add a Risk reason' drop-down list. You can remove a Risk reason by clicking the cross to the right of its name.
or
-
Assign Risk reasons to individual alerts by clearing the 'Apply to all Risk alerts' check box or clicking the button next to one of the alerts, and then selecting one or more Risk reasons from the right drop-down list beneath each alert. Risk reasons assigned to an alert appear next to the 'Add a Risk reason' drop-down list. You can remove a Risk reason by clicking the cross to the right of its name.
-
-
Add a comment about the risk to the Comment field. Alternatively, use the Comment Template drop-down field to select a template to automatically fill the Comment field.

-
Click the Complete Review button to complete the review of the incident.

The incident is moved to the ‘Closed’ list until a new alert is triggered for the same entity.
Reviewing All Alerts as No Risk
To review all the unreviewed alerts in an incident as ‘Risk’:
-
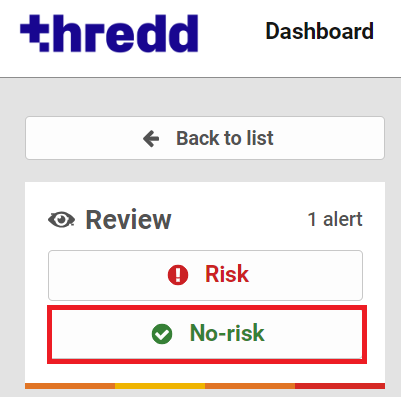
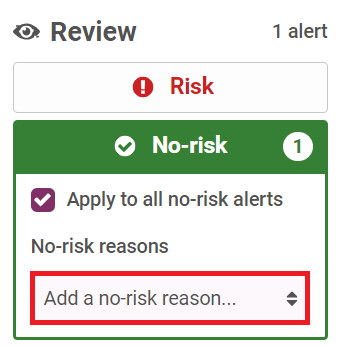
Click the No Risk button in the sidebar of the Incident Review page. The Risk review panel appears in the sidebar.
-
Either:
-
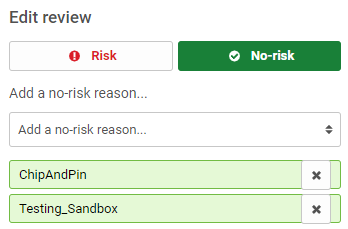
Select one or more No Risk reasons explaining your decision from the No Risk Reasons drop-down list in the sidebar. These will apply to all alerts in the incident. You can assign multiple No Risk reasons by repeatedly selecting them from the drop-down – the risk reasons assigned to this incident will appear beneath the 'Add a No Risk reason' drop-down. A risk reason can be removed by clicking the cross to the right of its name.
or
-
Assign No Risk reasons by clearing the 'Apply to all No Risk alerts' check box or clicking the button next to one of the alerts, then selecting one or more No Risk reasons from the drop-down menu beneath each alert. If you choose to assign No Risk reasons to individual alerts after assigning one or more No Risk reasons to the whole incident (as in step a), the No Risk reasons you assigned to the whole incident will be assigned to each individual alert. No Risk reasons assigned to an alert will appear next to the 'Add a No Risk reason' drop-down. You can remove a No Risk reason by clicking the cross to the right of its name.

-
-
Add a comment in the Comment field. Alternatively, use the Comment Template drop-down field to select a template to automatically fill the Comment field.
-
Click the Complete Review button to complete the review of the incident.
The incident is moved to the ‘Closed’ list until a new alert is triggered for the same entity.
Reviewing an Incident as a Mixture of Risk and No Risk
To review some of the alerts in an incident as 'Risk' and some as 'No Risk':
-
Click on either the Risk button (if the majority of the alerts are to be classified as 'Risk', or the No Risk button (if the majority of alerts are to be classified as 'No Risk')

-
Either:
-
Click the Risk button next to any alert(s) you want to review as ‘Risk’,

or
-
Click the No Risk button next to any alert(s) you want to review as ‘No Risk’.
Both Risk and No Risk review panels will be displayed in the Incident Review page sidebar, as shown above. The number of alerts to be reviewed as Risk and No Risk will be shown in the appropriate panels, next to the headings.
-
-
Either:
-
Select a risk severity and Risk reasons for all the alerts to be reviewed as ‘Risk’, as described in Reviewing All Alerts as Risk.
or
-
Select risk severities and reasons for each alert individually, as described in Reviewing All Alerts as Risk.
-
-
Either:
-
Select No Risk reasons for all the alerts to be reviewed as ‘No Risk’, as described in section Reviewing All Alerts as No Risk.
or
-
Select No Risk reasons for each alert individually.
-
-
Add a comment in the Comment field. Alternatively, use the Comment Template drop-down field to select a template to automatically fill the Comment field.
-
Click the Complete Review button to complete the review of the incident.
Adding a Comment
Comments can be added to an entity’s activity timeline, to provide other users with information in the context of the timeline.
To add a comment:
-
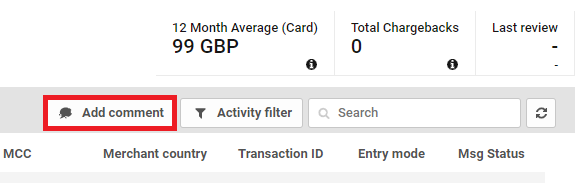
Click the Add Comment button in the gray bar above the activity timeline.
-
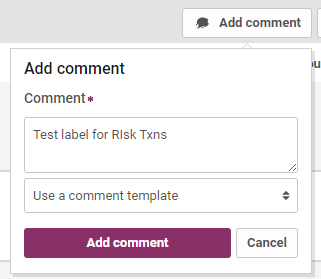
Add a comment in the Comment field. Alternatively, use the Comment Template drop-down field to select a template to automatically fill the Comment field.
-
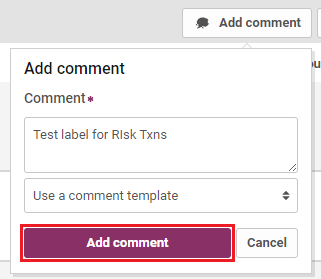
Click the Add comment button to add your comment to the entity's timeline.
Manually Creating an Alert
To manually generate an alert on a particular event:
-
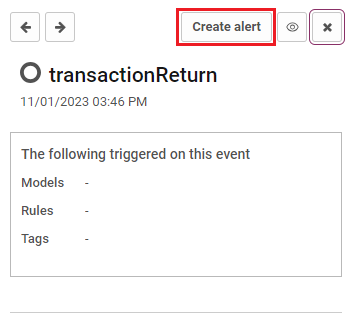
Click on the Eye icon to the left of that event in the activity timeline, to show the event details sidebar.
The Event Details Sidebar will open on the right-hand side of the page.
-
Click the Create alert button in the right-hand sidebar.
-
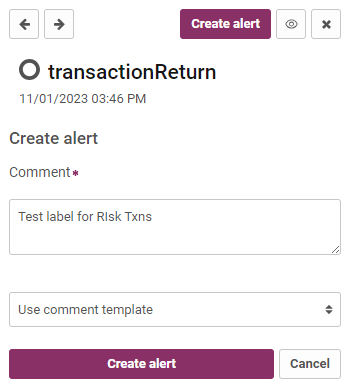
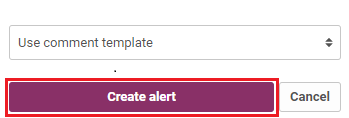
Add a comment in the Comment field. Alternatively, use the Comment Template drop-down field to select a template to automatically fill the Comment field.
-
Click the Create Alert button to create the alert.
The event becomes an alert in the activity timeline, and your manual creation of this alert also appears in the timeline as a user action. You or another user can now review this manually created alert.
Editing a Review
In the event of new information being received, any ‘Risk’ or ‘No Risk’ review in an entity’s activity timeline can be revised. For example, if an alert previously reviewed as ‘No Risk’ is discovered to be fraudulent, the decision can be changed. This allows other analysts to see a more accurate picture of the entity’s history, and teaches the portal’s models to better recognise high-risk events.
To edit a review decision:
-
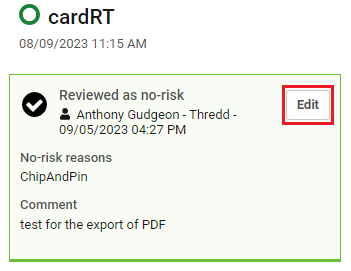
Click on the original alert review in the entity’s activity timeline.
-
Click the Edit button in the event details sidebar.
-
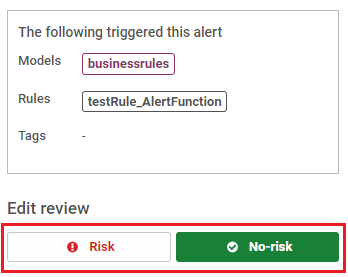
(Optional) To change a 'No Risk' review to 'Risk', click the Risk button, or to change a 'Risk' risk to 'No Risk', click the No Risk button.
-
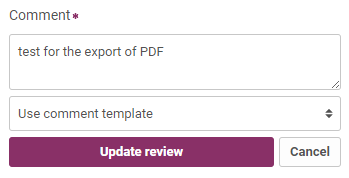
(Optional) Edit the risk severity (if applicable), risk/no risk reason(s) and comment as required.
-
Click the Update Review button.
Referring Incidents
You can refer an incident to particular users or user teams for analysis. This allows the reviewing workload to be divided between users, or re-assigned to users with review specialties (For example, a reviewer suspecting an incident results from bot activity could assign it to a user/team who deals with bot detection).
A referred incident displays the referred user or team in the ‘Referred To’ column of the incident list, and the incident will be added to the ‘Referred To Me’ incident list of the corresponding user (or user team members).
To refer an entity/incident:
-
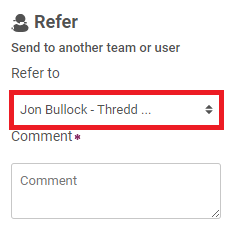
Click the Refer button in the review actions sidebar.

-
Click the Refer to drop-down to select the team or user to refer this incident to.
-
Add a comment in the Comment field. Alternatively, use the Comment Template drop-down field to select a template to automatically fill the Comment field.
-
Click the Refer Incident button to refer the incident to your chosen user or team.
Pending Incidents
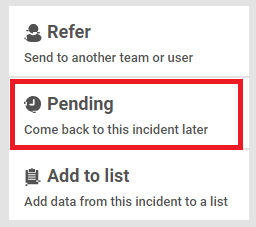
Incidents can be moved to the Pending list, to postpone incident review until further information has been gathered. An incident can be added to the Pending list indefinitely, or for a specified period. Incidents in the Pending list can be reviewed as normal.
To add an incident to the Pending list:
-
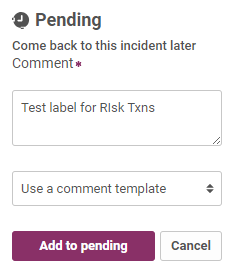
Click the Pending button in the review sidebar.
-
Add a comment in the Comment field. Alternatively, use the Comment Template drop-down field to select a template to automatically fill the Comment field.

-
Click the Add to Pending button.
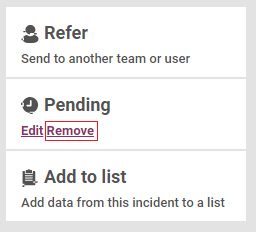
Removing an Incident from the Pending List
To remove an incident from the Pending list, click the Remove button where it is displayed as part of the Pending button in the review sidebar.
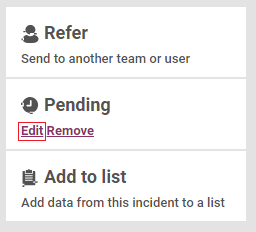
Editing a Pending Timeout Duration
To edit or remove the timeout duration you set, or to edit the comment you gave for the incident, click on the Edit button where it is displayed as part of the Pending button in the review sidebar.
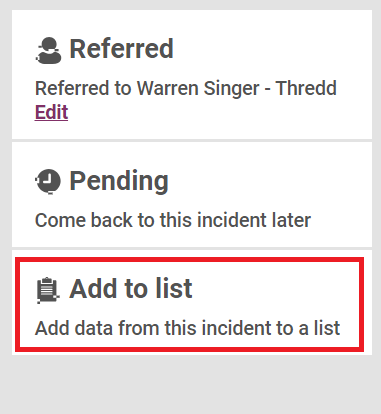
Adding Items to a Data List
Data from an entity's event history can be added to a data list, using the 'Add to List' button in the review actions sidebar. This allows you to add an entity, IP address, device ID or other information to a list, which rules and other analytics can access. For example, add an IP address to a negative list to enable a rule to trigger an alert if any customer attempts to log in from this address.
To add new items to a data list from the Incident Review page:
-
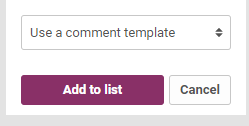
Click the Add to List button in the review actions sidebar.
-
From the drop-down list, select the data list you want to add new value(s) to.
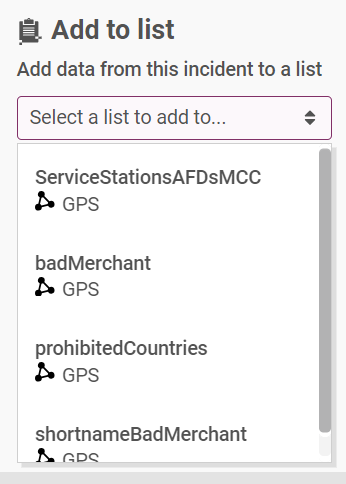
The values to be added to the list will be shown beneath the drop-down.
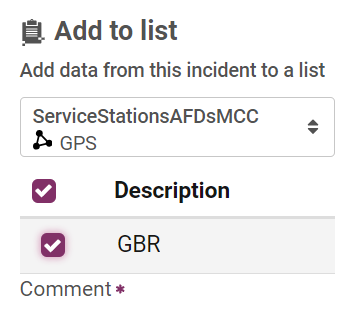
You can remove any values that should not be added to the data list by clicking the at the right-hand side of those values. This will remove those values from the 'Add to Data List' panel.
-
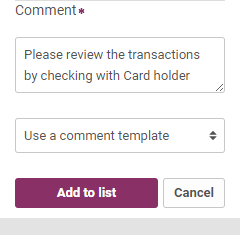
Add a comment in the Comment field. Alternatively, use the Comment Template drop-down field to select a template to automatically fill the Comment field.
-
Click the Add to List button to save your changes to the data list.